Editorial process and endresult
Ik was erg aan het twijfelen tussen de ‘bredere doelgroep’ versie en de ‘experimentele’ / ‘gerichtere doelgroep’ versie. Uiteindelijk koos ik voor de ‘bredere doelgroep’,… Read More »Editorial process and endresult
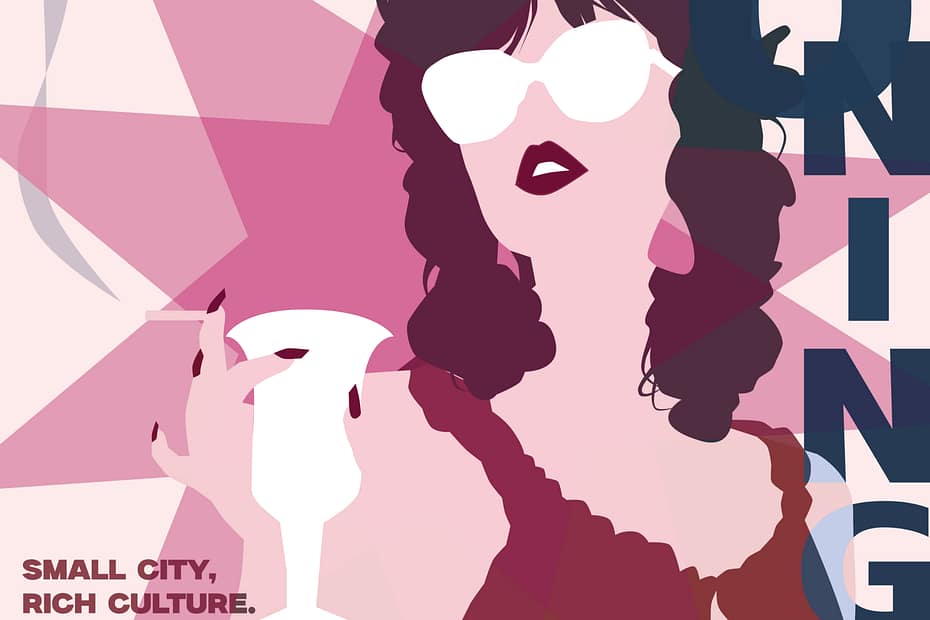
neutral magazine
process: painted “designs” spiral and glue binding
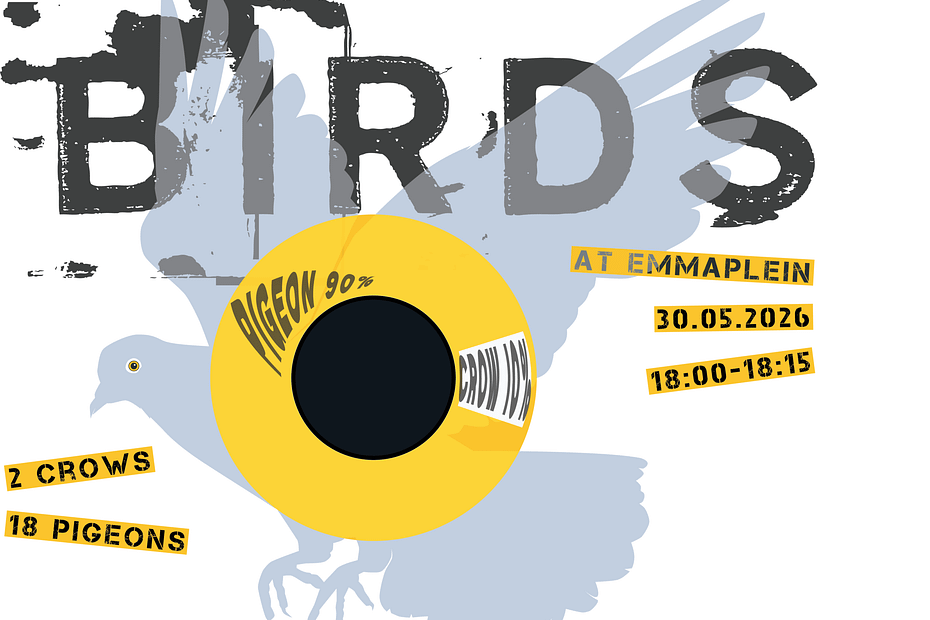
experimental magazine
process:
WEEK 6-11
INSPO Where did I start Where did I go further Neutral proposal Atmosphere and experimental proposal Cover All changes Final Result
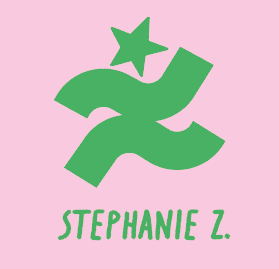
Logo design
As a small final assignment I created a logo for Stephanie. Her keywords were: dancing, fun, bright green. So I created a logo that is… Read More »Logo design
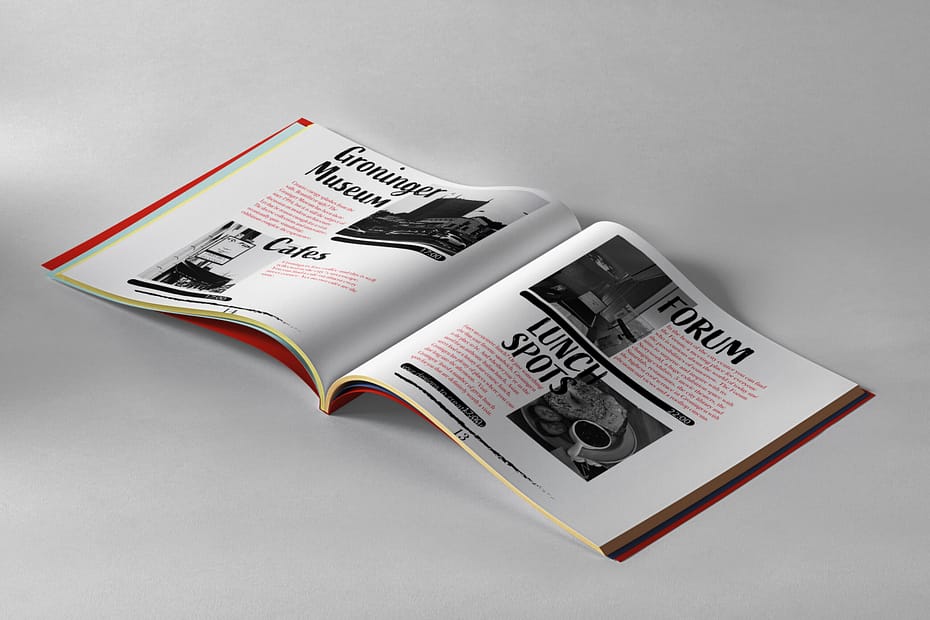
Week 13-16 – Studio
I decided to challenge myself and go (almost) fully analogue for the magazine. I created my own font from my handwriting and wrote all the… Read More »Week 13-16 – Studio
WEEK 11-16 ( FINAL / COVER)
Final + Cover
Logo Design
I decided to finalise all three sketches I had for Mees’ logo. Her favorite was the film one.
week 3
1. The Now this is my infographic about the cafeteria in my neighborhood, I wanted to track for 5 weeks what the milkshake of the… Read More »week 3
progress magazine
Minimalist pages I didn’t really like these because it just wasn’t my style at all. It was also very hard to make because, I really… Read More »progress magazine
Logo design for myself
I wasn’t much in class due to health circumstances but I was able to still try to do this assignment even though I didn’t have… Read More »Logo design for myself
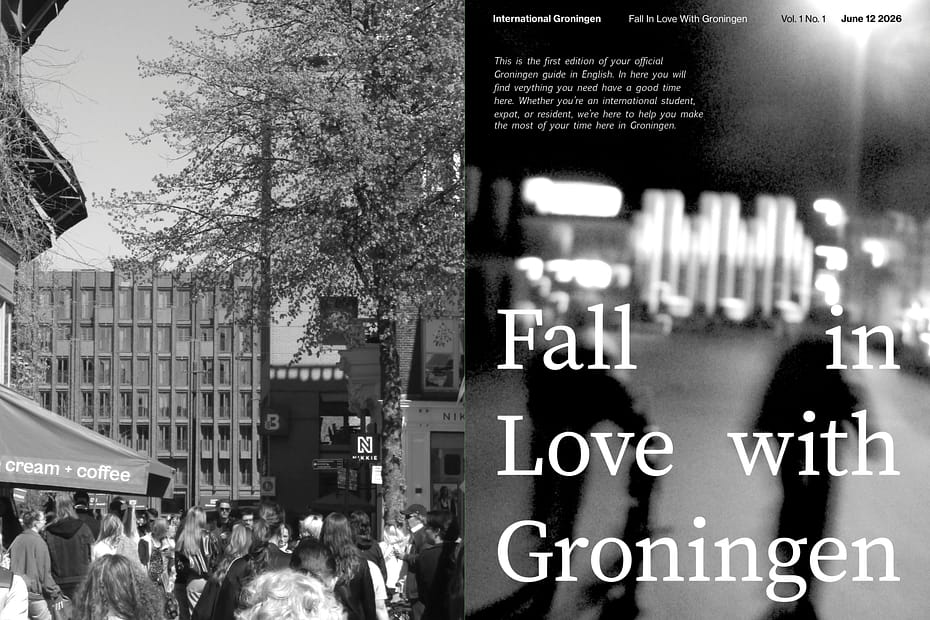
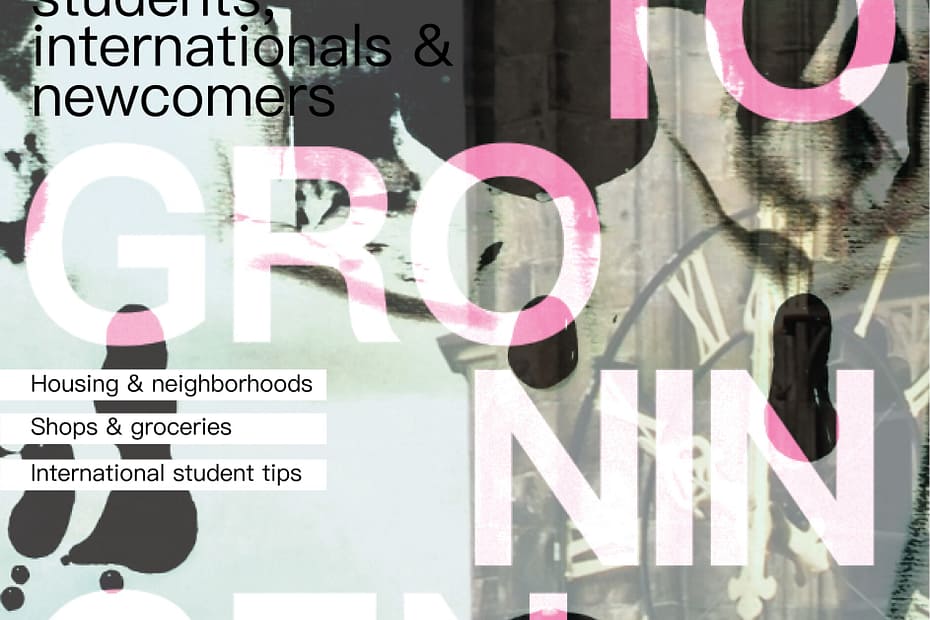
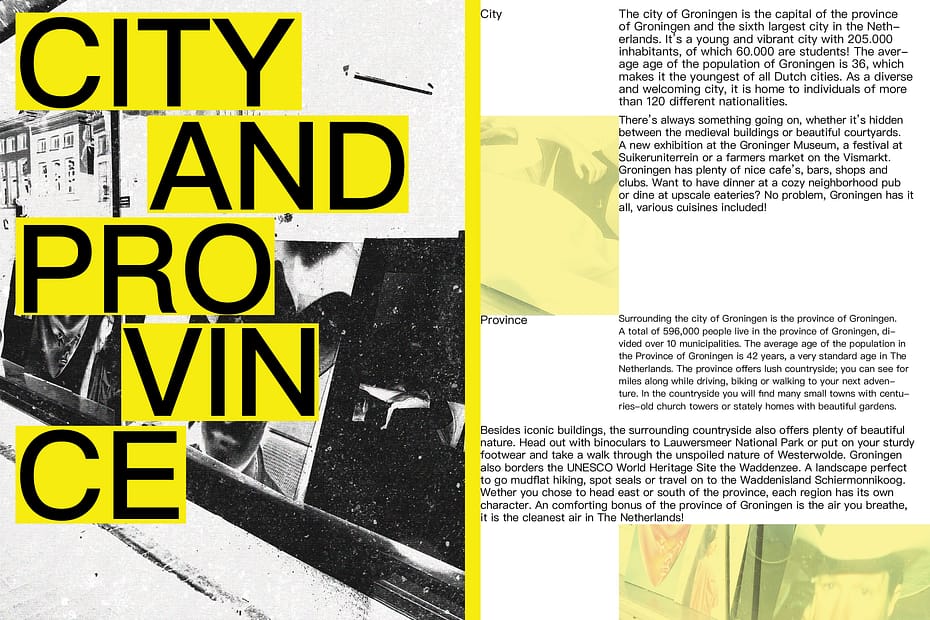
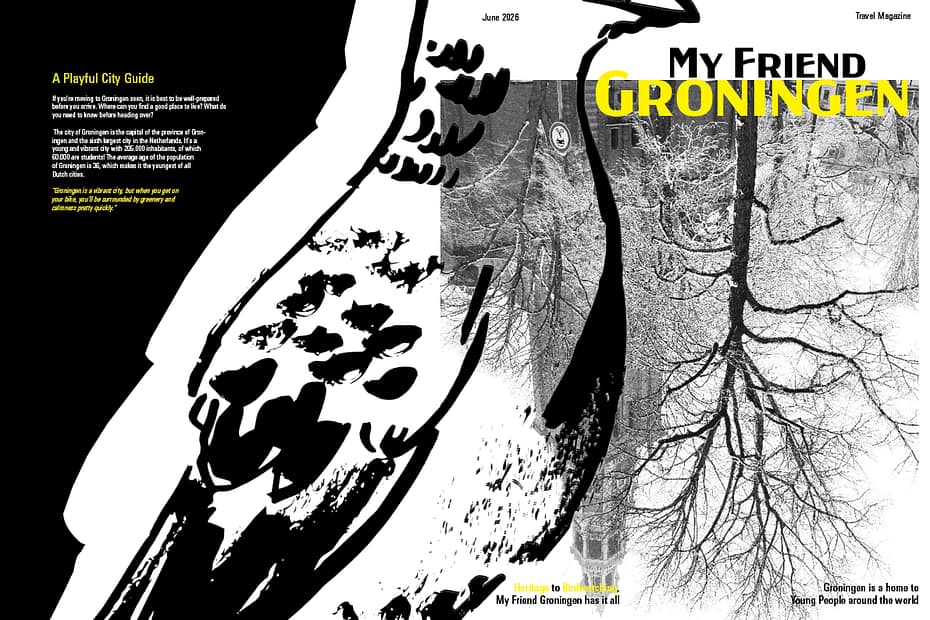
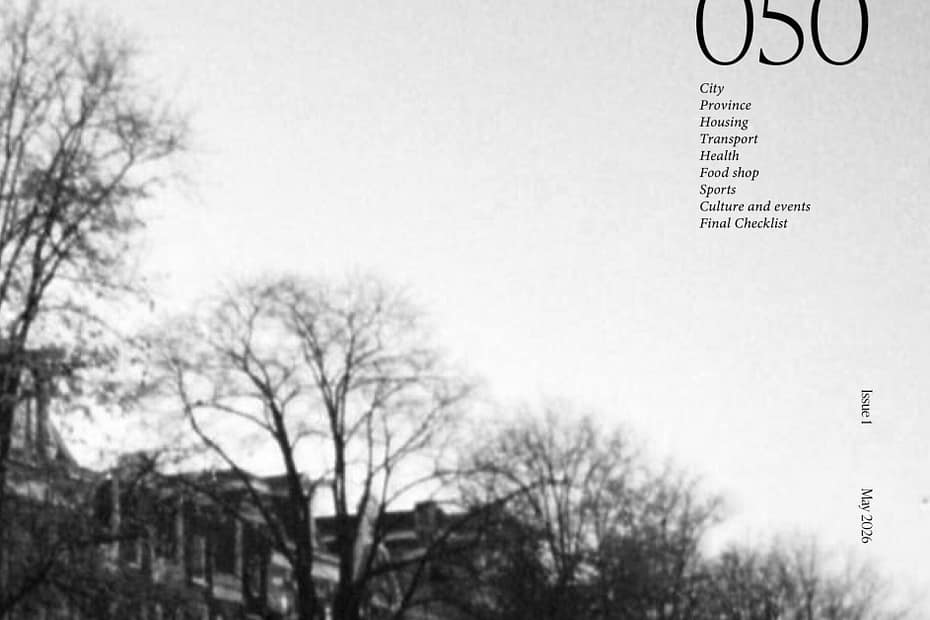
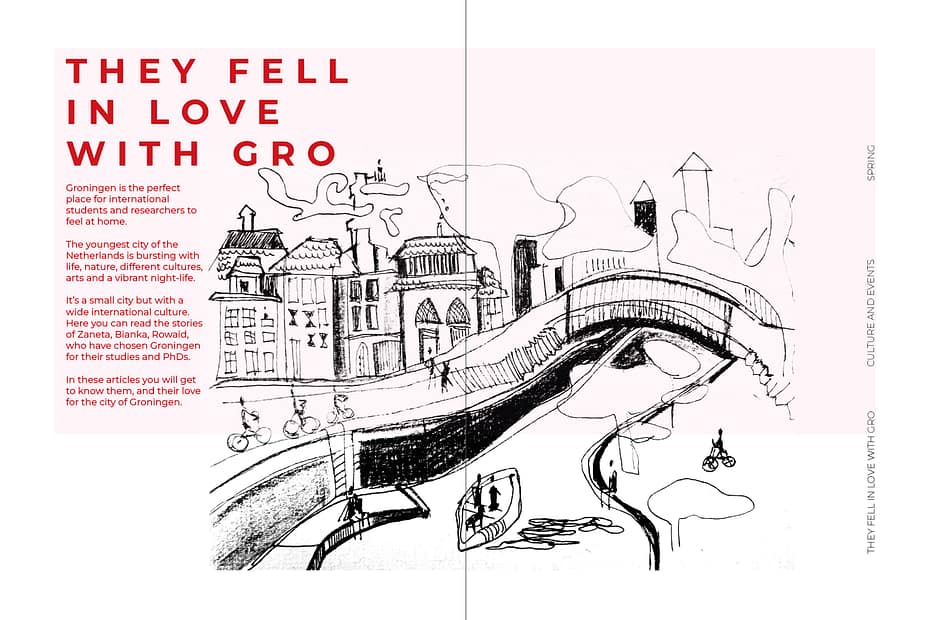
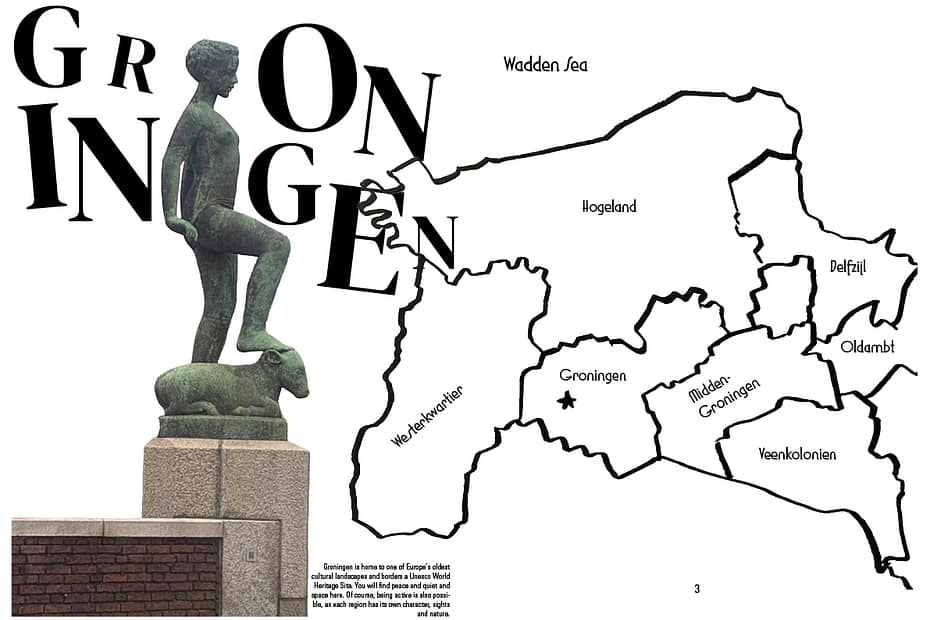
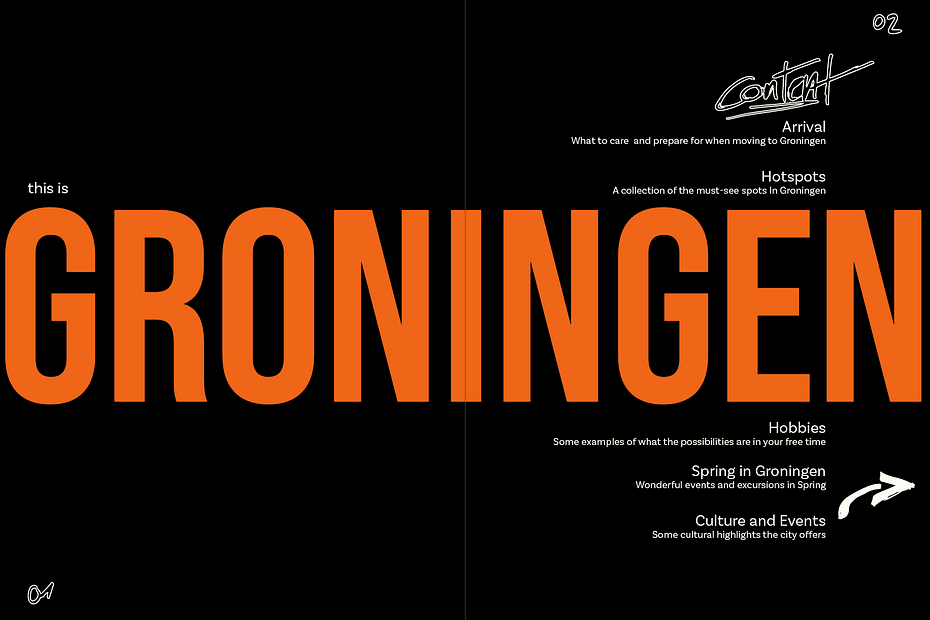
Final magazine ‘about Groningen’
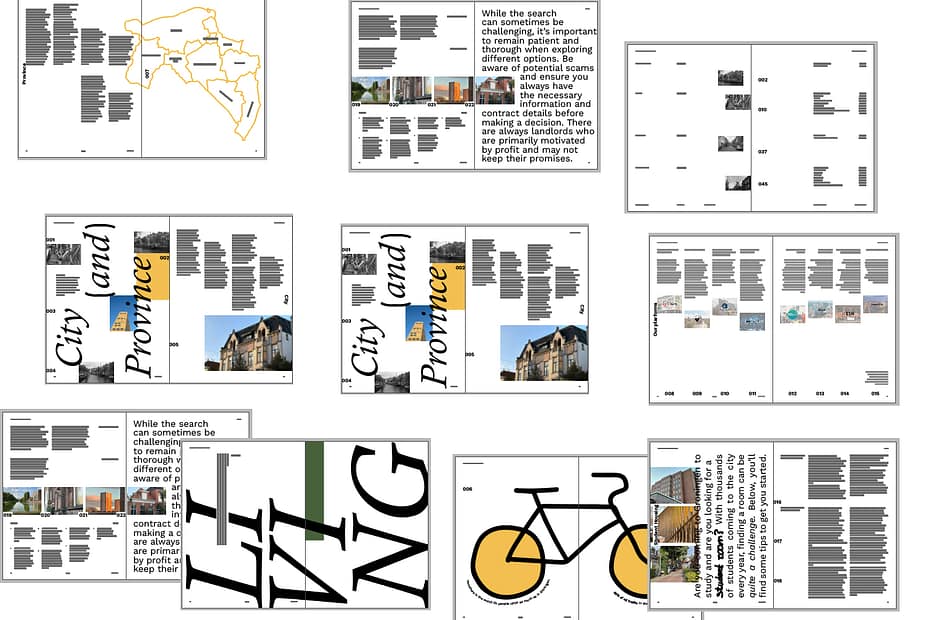
After the talk with Michiel I wanted to go for an expressive type of magazine. Very graphic in way of a collage kind of thing.… Read More »Final magazine ‘about Groningen’
Final- editorial design- Jornt Hendriks
Final design for magazine This is my definitive choice for the style of the magazine. I experimented a lot with typography and the placement of… Read More »Final- editorial design- Jornt Hendriks
Detailed typography – Jornt Hendriks
Here is my file to the assignment detailed typography. Personally, I think this was one of the hardest assignments for me. It was, and still… Read More »Detailed typography – Jornt Hendriks
Logo design for classmate- Jornt Hendriks
I was allowed to design three logo options for my classmate Tetiana. In her form she said that she likes to swim, live an active… Read More »Logo design for classmate- Jornt Hendriks
Grids- assignment- Jornt Hendriks
Pictures: Sketch: Final Grids: I would like to excuse myself, since I was not able to put the lyrics into the grid boxes, since I… Read More »Grids- assignment- Jornt Hendriks
Studio_week 6-16 * Editorial design
*1: Inspiration #1: Minimal design + What I like about these designs: bold shape, high black-white contrast, visible grid + What I like about these… Read More »Studio_week 6-16 * Editorial design
Logo design
Although I was unable to attend the final class due to having an exhibition for my off-course project on the same day. I still completed… Read More »Logo design
WEEK 11-16 (CONTINUED PROPOSALS + FINAL + COVER)
Cover options (final the 2nd) Spreads (final) Propsal.1 redesigned Proposal.2 continued
WEEK 6-11 STUDIO (INSPO + 2 PROPOSALS)
Proposal.1 This is an informative magazine where I focused on presenting general information gathered from a website. I collected details and organized them into a… Read More »WEEK 6-11 STUDIO (INSPO + 2 PROPOSALS)
week 11 & 12
final work on magazine. I decided to merge both of my proposals together. I used illustrator to edit the images and placed the text in… Read More »week 11 & 12
STUDIO WK 5 – 16
Final Design: Process: The idea at first was to make a collage out of pictures that I took. I printed pictures out and tried to… Read More »STUDIO WK 5 – 16
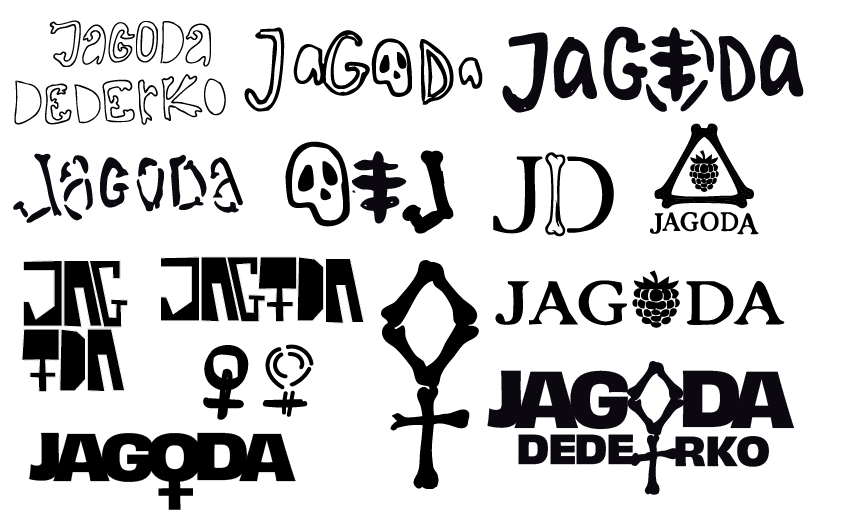
Studio_logo design
My logo is for Jagoda Dederko. __________________ First designs ________________________ Working further on the design ____________________________ All the logo’s
Studio 2 – Week 12 – 14
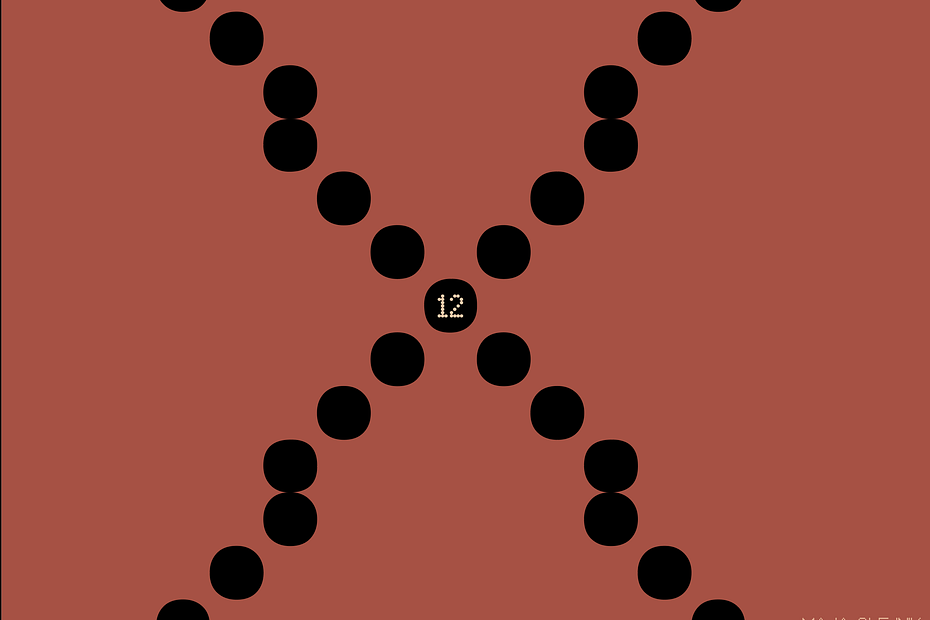
In weeks 12 to 14 i worked on the three inforgraphics in my magazine Infographic 1 – Neighborhood Infographic 2 – Nightlife Infographic 3 –… Read More »Studio 2 – Week 12 – 14
Final magazine!
After talking to Maaike I changed some spreads to make them a little more playful through out the whole magazine.
week 11-16
I again started with sketching some stuff, trying to figure out how I would like some infographics to look: I struggle a little bit with… Read More »week 11-16
week 6-11
I started by writing down the first words and thought that come to mind for the magazine. For this first proposal I decided to try… Read More »week 6-11
Week 11-16
I decided to continue with the design I made for the specific audience. I received the feedback of Maaike that my work was too consistent… Read More »Week 11-16
STUDIO WK 12-16 – Anna Kannemeyer
Cover Inspirations Final 10 Spreads Cover Experiments Final Cover Drawings
Editorial Design (week 12-16)
My final magazine design after 10 weeks combines elements from both initial proposals. I kept the minimalism of the first concept while incorporating the boldness… Read More »Editorial Design (week 12-16)
Logo Design – By Namsom
Since she loves climbing, I think of mountain shape because it’s align with the alphabet of her name and her favorite color is blue so… Read More »Logo Design – By Namsom
STUDIO – LOGO DESIGN
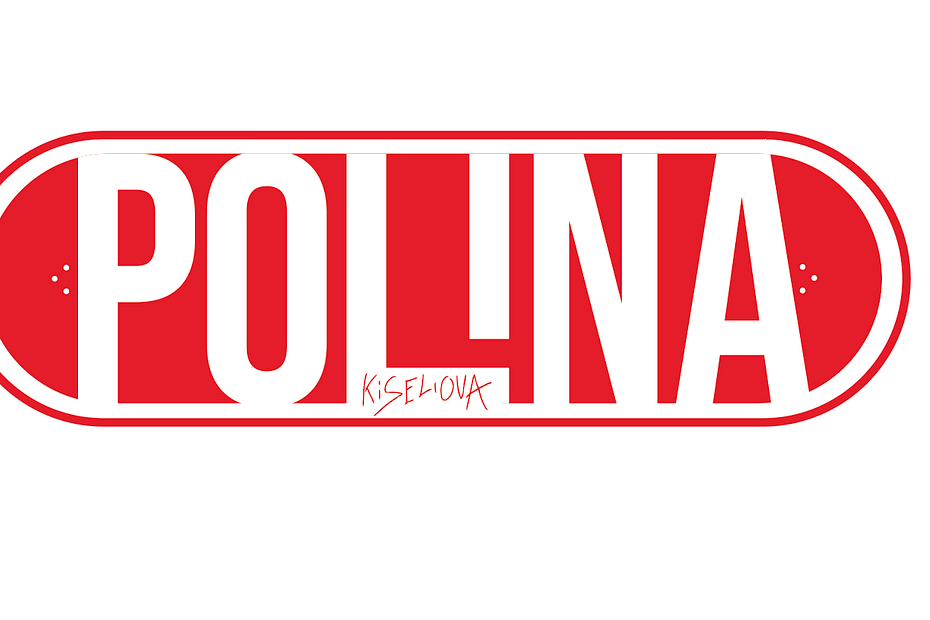
My task was to create a logo for Polina. The information she gave me was her favorite color (red), one of her personality traits (calmness),… Read More »STUDIO – LOGO DESIGN

Logo Design
I had to make a logo for Cirse van Dijk, the information I had to work with was that her interest is ‘baking’, her personality… Read More »Logo Design
Studio logo design
Designed logo’s for Simona Edreva sketches of logos Digitalized logo
Studio / Logo design
Assignment: Logo design . Design a logo for each other – you are both client and designer.. The logo should contain your name !! (full… Read More »Studio / Logo design

Logo assignment
I had to make a logo design for Nur L, the information I received was: -watching videogames -hardworking -turquoise. My first idea was to make… Read More »Logo assignment
week 11-16 one proposal +cover
i have not chosen one proposal from two created, instead i have combined them, found a middle ground, where i can still keep my illustrations,… Read More »week 11-16 one proposal +cover
Studio / Week 11 – 16
The proposal I picked: Process: I chose my second proposal because I thought it was more fitting towards my target group. For this proposal I… Read More »Studio / Week 11 – 16
FINAL DESIGN PROCESS
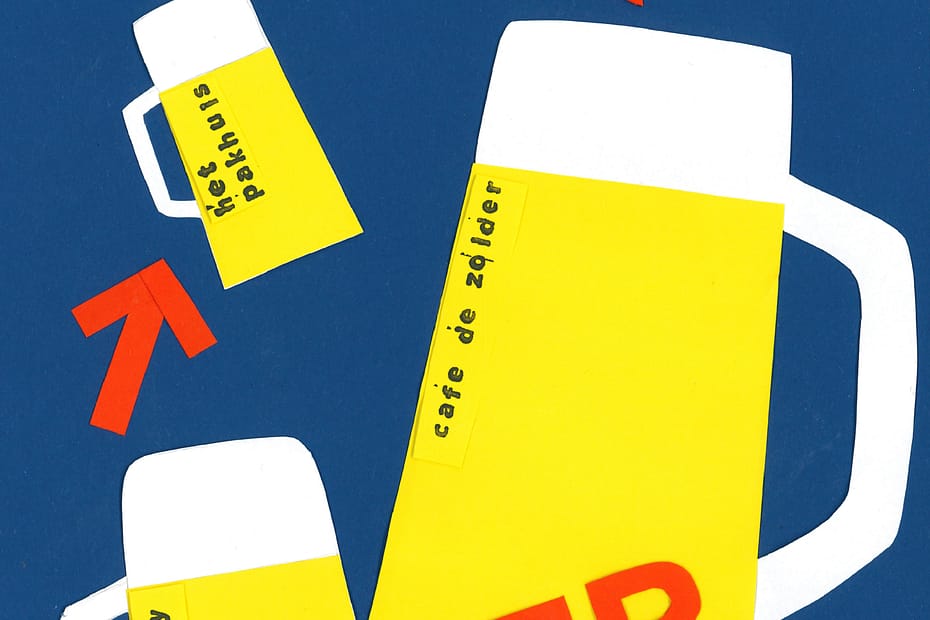
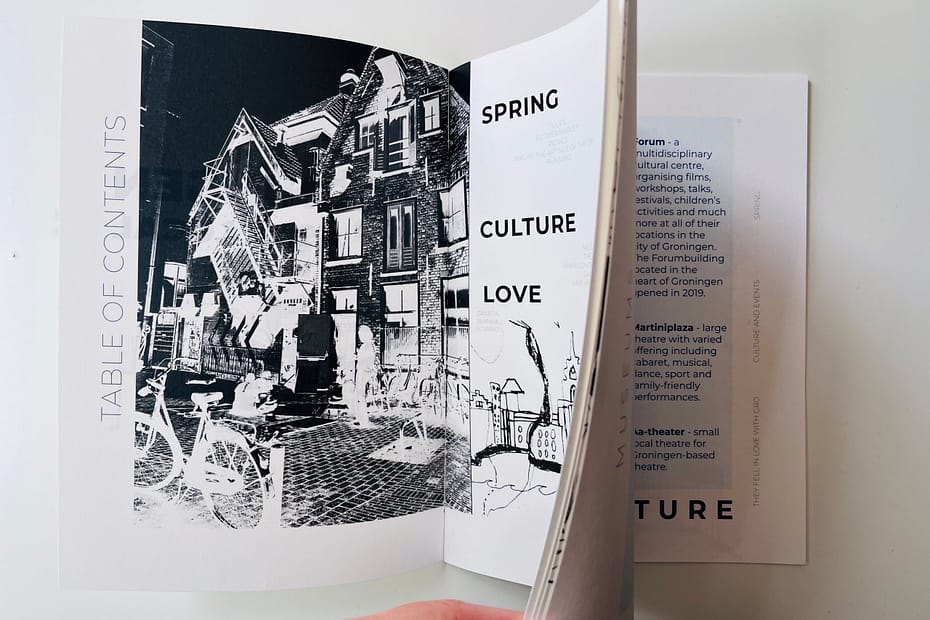
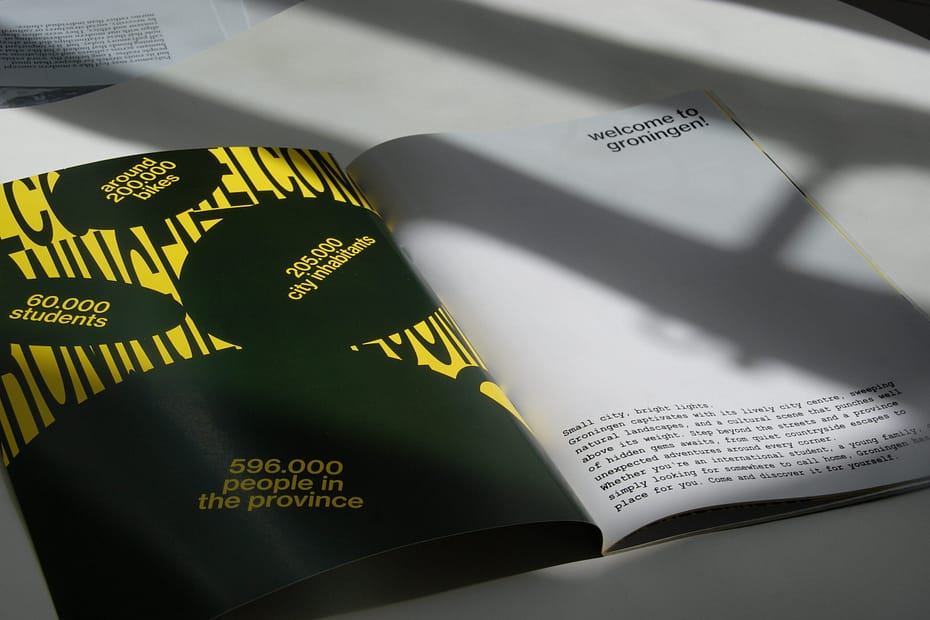
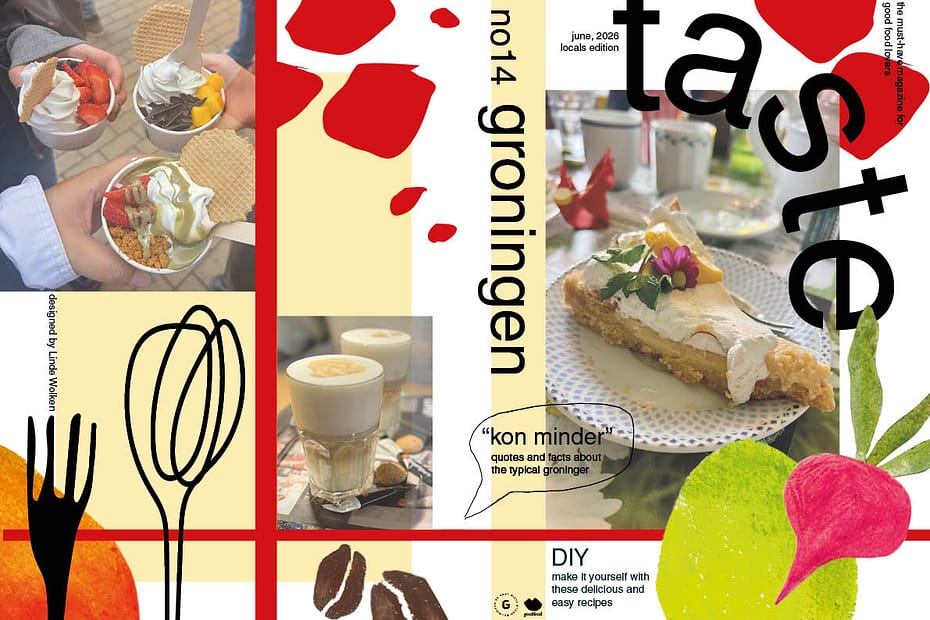
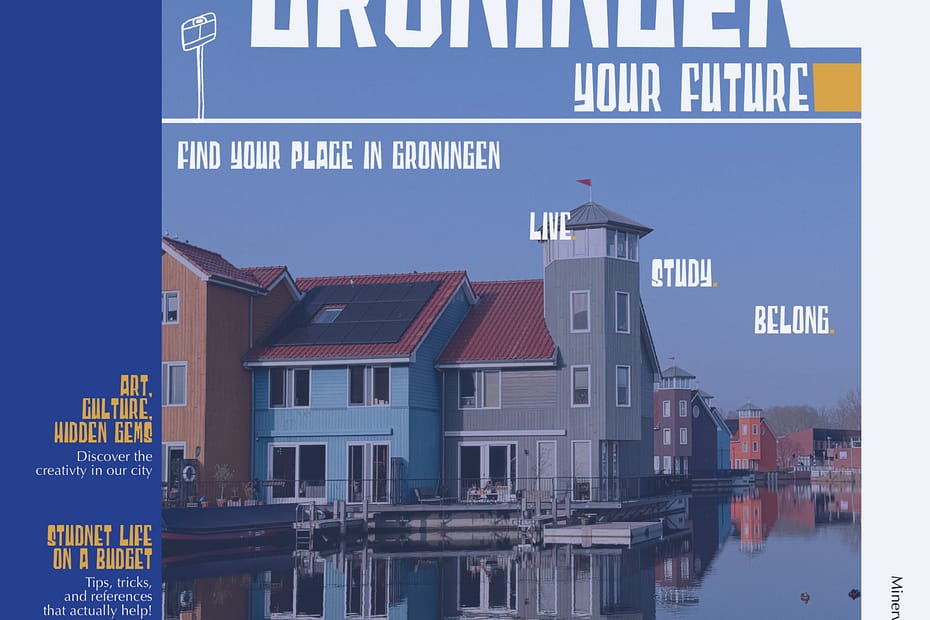
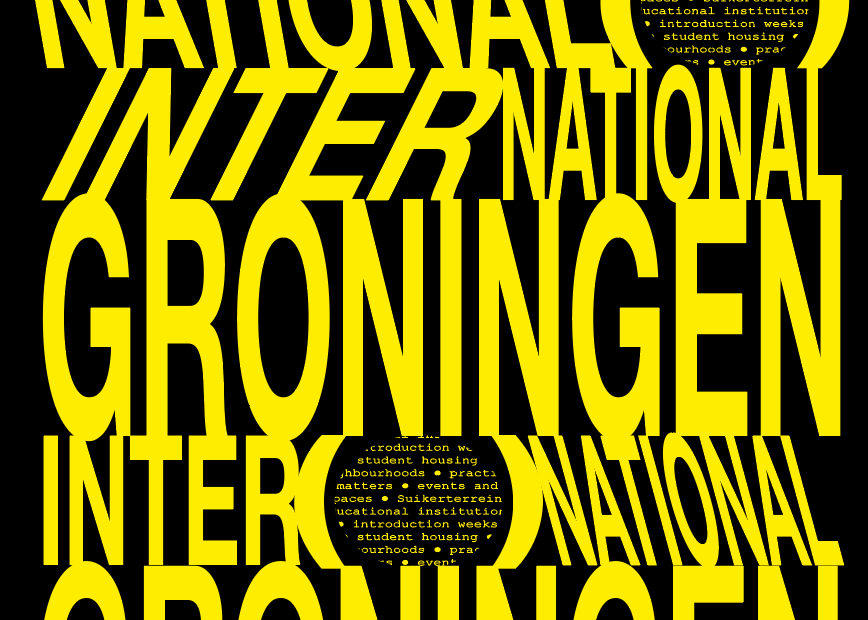
For the final design I decided to combine my two designs: experimental chapter opener pages and more minimal content pages. I went with the yellow… Read More »FINAL DESIGN PROCESS
blog.5 ✴︎ magazine.wrap.up
adjustments finalizing the spreads (adding pictures + making infographics) unfinished: ^ picture on the right page
WEEK 11-16
In the end I am satisfied with how the magazine turned out. I have been experimenting and learning a lot during this process and I… Read More »WEEK 11-16
STUDIO2 / WK11-16 by Namsom
Continue on the certain design that I chose and adjust the decoration or some pages I got the final design for 10 spread the apply… Read More »STUDIO2 / WK11-16 by Namsom
week_13-16_editorial_magazine_spreads˖᯽ ݁˖· ─
PROGRESS These are the spreads I’ve made in the meantime with the first spread concluding an infographic. I’m noticing that I find it a bit… Read More »week_13-16_editorial_magazine_spreads˖᯽ ݁˖· ─
STUDIO – WEEK 13
Spreads: Opener of a chapter continuations of a chapter Layouting experiments: Other experiments:
STUDIO WK 6-11 – Anna Kannemeyer
Inspirations Minimalist Maximalist PROPOSAL 1 – neutral PROPOSAL 2 – illustrative
STUDIO WEEK 11-16
inspiration First tries Final result
STUDIO2/ WEEK 11-16
I chose to go with proposal 1 because i felt like it would be more of a challenge for me to approach this style. More… Read More »STUDIO2/ WEEK 11-16
Studio week 11-16
Week 13 I started by cutting and shuffling my proposal designs to see what works as a layout and what doesn’t. I then looked online… Read More »Studio week 11-16
WEEK 12- 16
Typography I experimented with different font pairings, and tried out serif and non-serif fonts. I decided to go with the serif fonts and choose a… Read More »WEEK 12- 16

Studio / Week 13
Homework: Minimum of 5 spreads In which we can see multiple elements having a place at least one of these: – an opener of a… Read More »Studio / Week 13
two proposals
first proposal second proposal

WEEK 6-11
EDITORIAL INSPIRATION EXAMPLES NEUTRAL, INFORMATIVE DESIGN When designing my proposals this is the version that I started with. The target age group that I had… Read More »WEEK 6-11
WEEK 4
The part of my timeline, that I decided to research more about is my garden. I decided to collect data about flowers I found there.… Read More »WEEK 4
STUDIO EDITORIAL DESIGN week 11-16
working on my chosen proposal incorporating some parts from my other proposal with this one to make the final current process: finalising the layout &… Read More »STUDIO EDITORIAL DESIGN week 11-16
week_6-11_editorial_magazine_spreads˖᯽ ݁˖· ─
Up until now I’ve made my first few spreads in a style I feel represents my character the most. What I struggle with at the… Read More »week_6-11_editorial_magazine_spreads˖᯽ ݁˖· ─

Week 7-11 – Studio
Design Proposal 1: neutral, minimalistic Version 1.0 Version 1.1 Version 2.0 Version 3.0 Design Proposal 2: more personal, atmospheric

WEEK 6 – 11
Design Proposal 1 Inspiration, Minimalistic but chique. Curvy but readable typography, small “risky” details such as tilted or cut off text. Combined with big clear… Read More »WEEK 6 – 11
week 6- 11
I gathered info from the website and chose the chapters I wanted to make. For every subject I used a spread. I added or left… Read More »week 6- 11

Editorial Design (week 6-11)
Inspiration for proposal 1 For this proposal I will make it more of an overview of the website, primarily focusing on students. Using a two… Read More »Editorial Design (week 6-11)
Editorial week 11
Specific audience
WEEK 11 design proposals/process. spreads
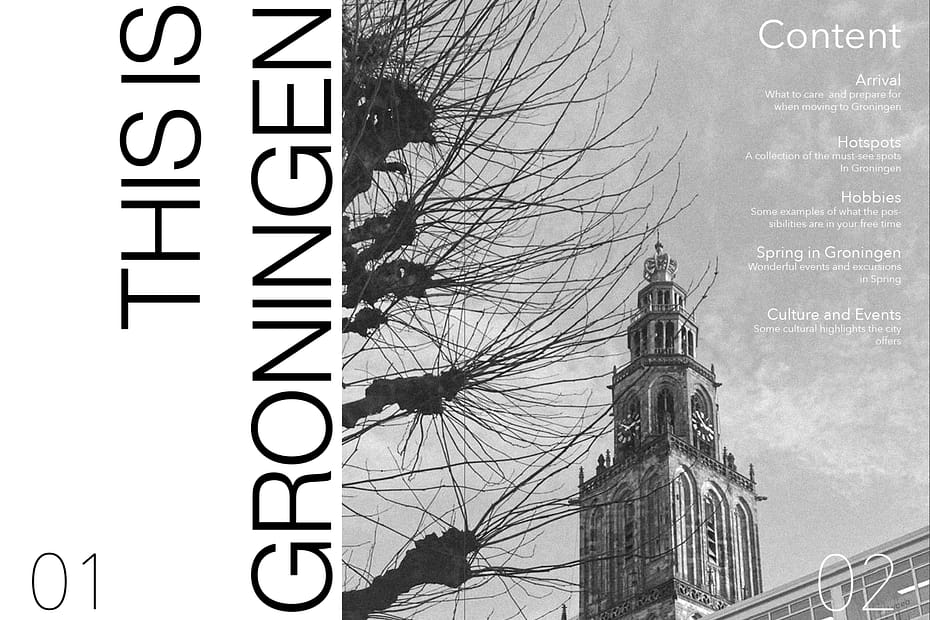
FIRST PROPOSAL has a lot of white space, its neutral, target audience is international students. All photos are black and white to keep the simplicity,… Read More »WEEK 11 design proposals/process. spreads
Magazine Design Proposals
NUMBER ONE NUMBER TWO NUMBER THREE
STUDIO – WEEK 11
Updated spreads and both design proposals Informative, Readable, Neutral Atmosphere and form predominate, Experimental Color palette: Orange, black and white/beige; to highlight the national color… Read More »STUDIO – WEEK 11
spreads
neutral experimental
magazine inspirations
I liked the minimalistic design on most of the pages, as well as all the different ways of using photography in a design. What also… Read More »magazine inspirations
WEEK 10 – Book
Target group: all kinds of students. (Coming to or are already in Groningen) Taking a look at the website: -Text: you have a introduction to… Read More »WEEK 10 – Book
6-11
Inspiration minimalist For a minimalistic design proposal I would like to keep it very simple, but still playfull and use mostly black and white and… Read More »6-11
Magazine week6-11
picking inspiration out of library sketches proposal one proposal 2 final proposal second proposal final version
Week5
I redesigned my infographic about student count on the graphic design floor(now I compared two days) Fist infographic that I redesigned
week 7 & 8
magazine 2
Week4
Factual information I decided to do infographic about what shops do I see on my way to Minerva
Studio 2 – Week 10
between week 7 and 10 i have experimented a lot with different visuals for me to proposals. i am still in the process of finishing… Read More »Studio 2 – Week 10
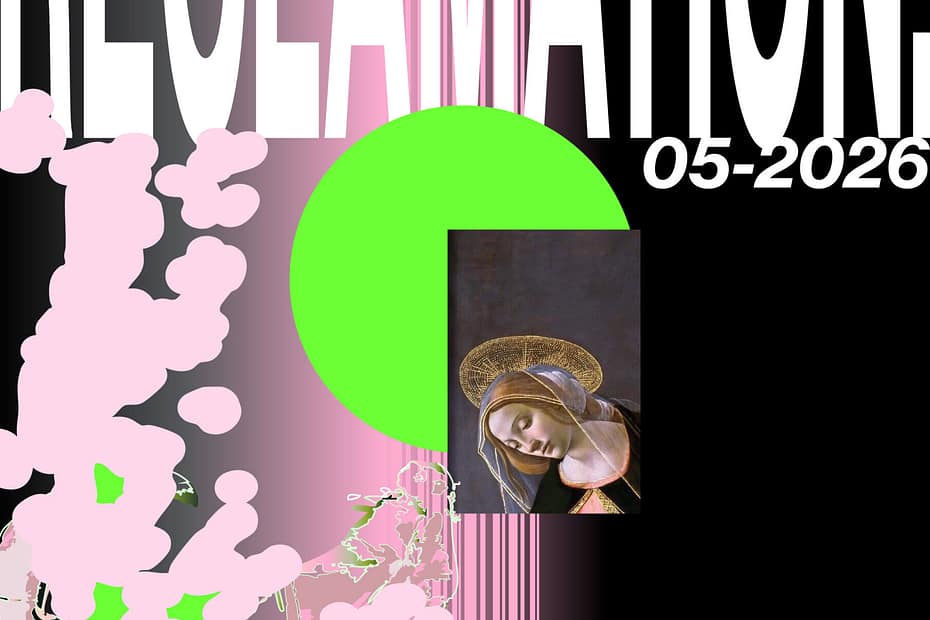
week_6-11_editorial_magazine_texts˖᯽ ݁˖· ─
Biblical Womanhood Magazine: Magazine Structure Overview Title Suggestion: RECLAMATION: The Truth About Biblical Womanhood Total: 12 spreads (24 pages) & cover Spread 1: Introduction /… Read More »week_6-11_editorial_magazine_texts˖᯽ ݁˖· ─
STUDIO – WEEK 10
Neutral Magazine – Process so far Updated Moodboard Sketches Photographs Spreads – First Idea Spreads – Second Idea
week_6_editorial_design_inspiration˚˖𓍢ִ໋❀.☘︎
2. TEXT/GRID SYSTEMS 3. PHOTOGRAPHS 4. COLLAGE 5. INFOGRAPHIC
week 9 process
so far I have worked on the “neutral ” variation of the magazine design . spread 1 spread 2 spread 3 spread 4
CONCEPT
For my magazine I’m leaning towards few ideas. One would be a magazine showing a walking route that focuses on interesting interiors/ architecture of Groningen.… Read More »CONCEPT
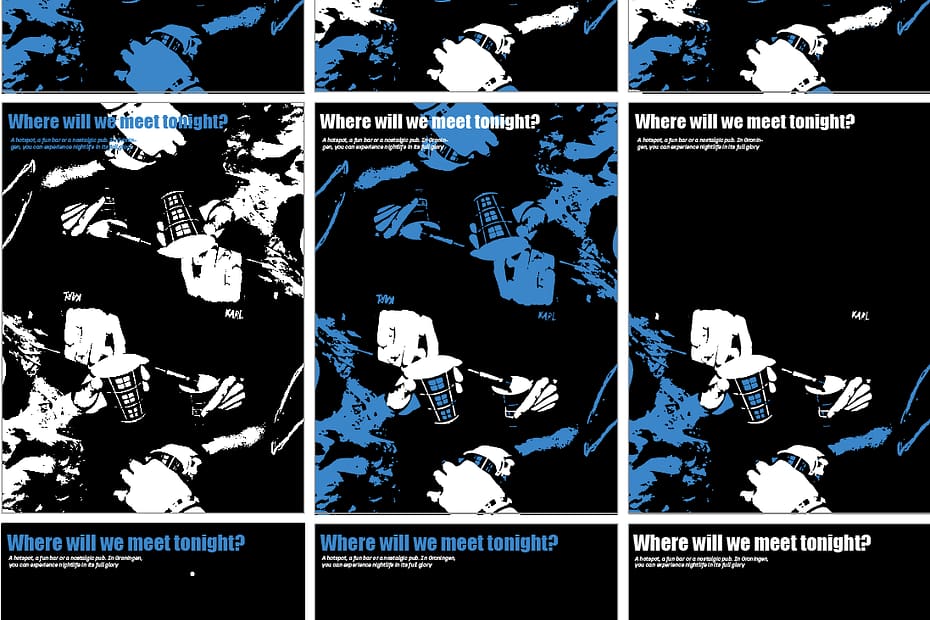
Editorial
General proposal Theme and illustrations I was thinking immediately about a hand holding a coin to ‘express’ (low)- budget. I made these blue dots with… Read More »Editorial