For this weeks infographic I decided to satisfy my own curiosity. I know a lot of people who are either vegan or vegetarian and I wanted to do some research and see what the actual statistics were. I created a google forms and sent it to a group chat with Minerva students. From there, I created an infographic with the collected data.
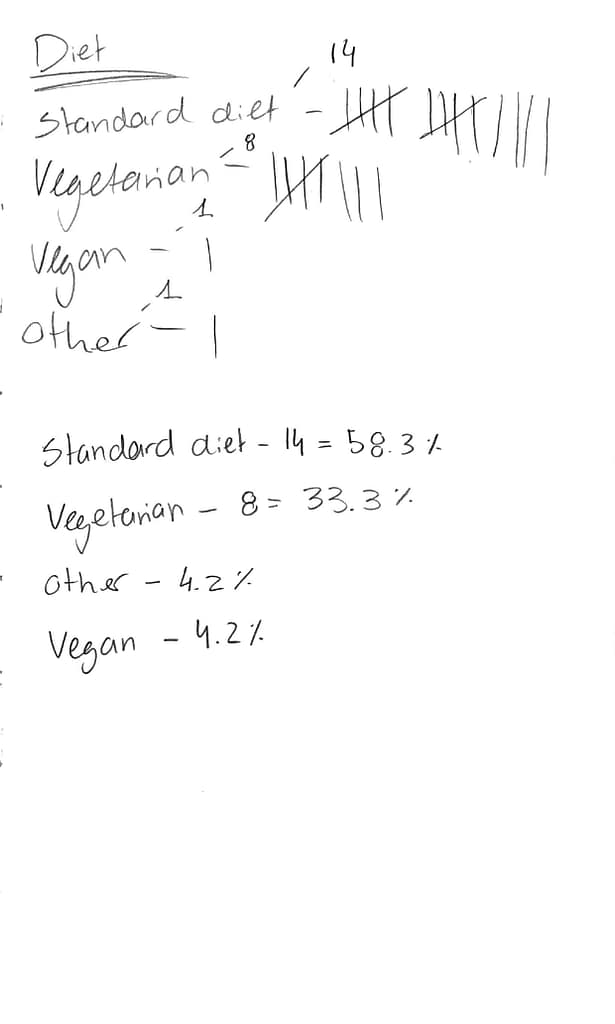
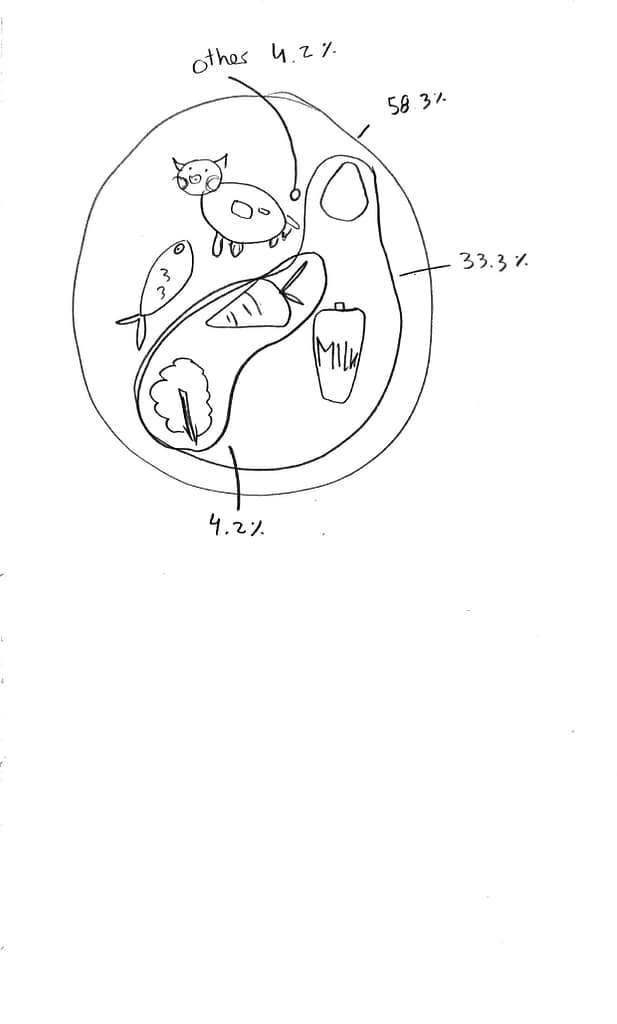
Sketches
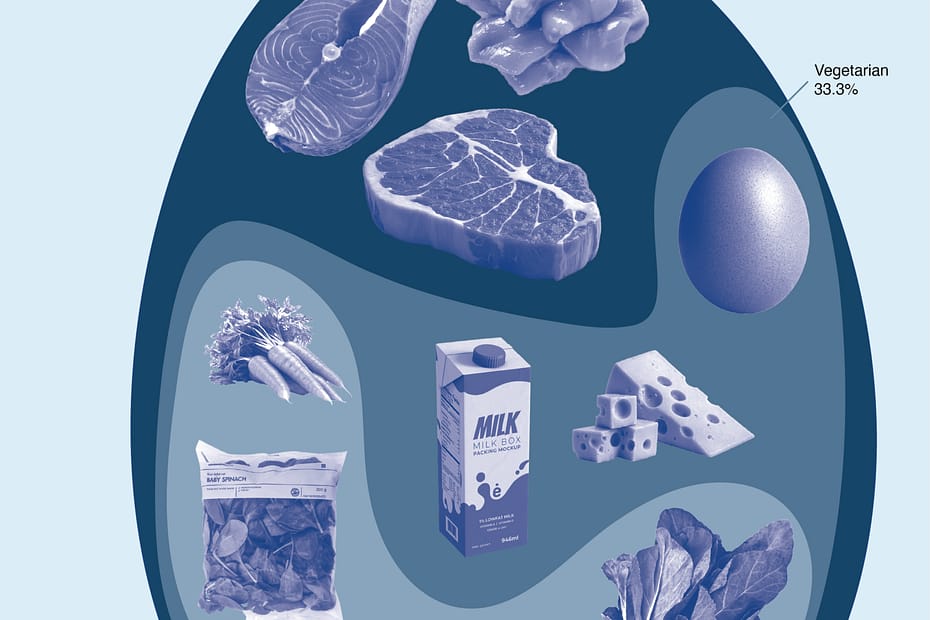
Final Version
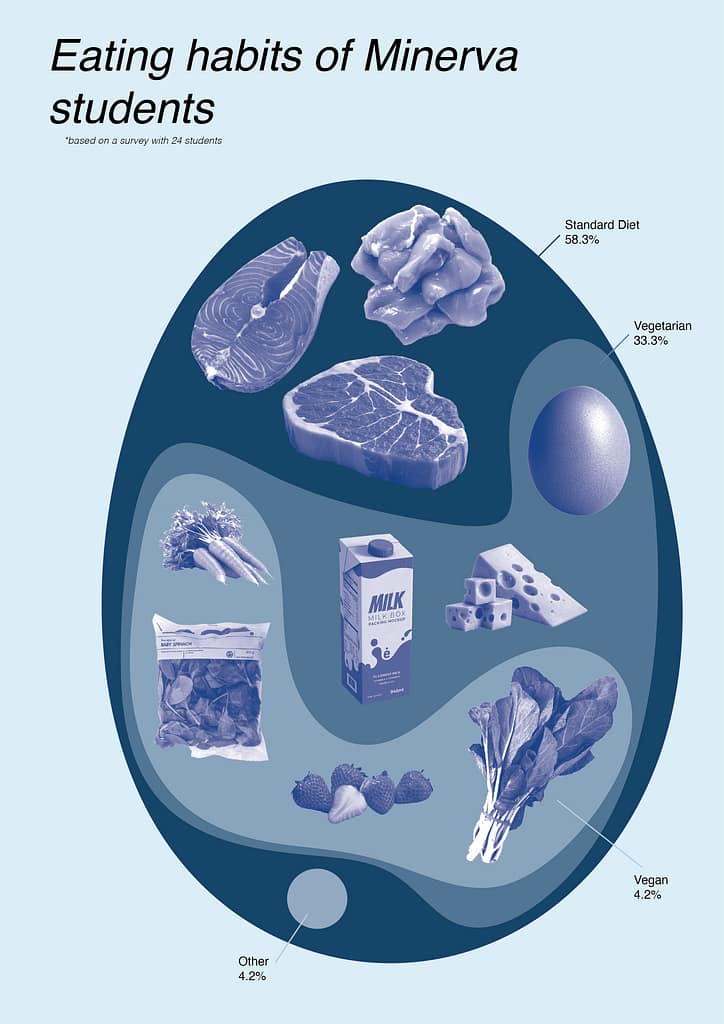
This research satisfied the curiosity I had in the beginning. I thought there would be more vegans and vegetarians, but overall it was very interesting to see the actual statistics.
My target audience for the infographic are the Minerva students who, like me, also find these kind of facts interesting.