A). MINERVA DATA
Thinking about data around/surrounding Minerva, I quickly noticed that nothing interested me enough to make an infographic about it. After sitting on it for a while, I thought of the posters in the entrance hallway. I always quickly glance over them to see if there’s one i find cool or that caughts my eye. Therefore, I made the infographic visualizing the contents of the posters hanging here.
- To be continued <3
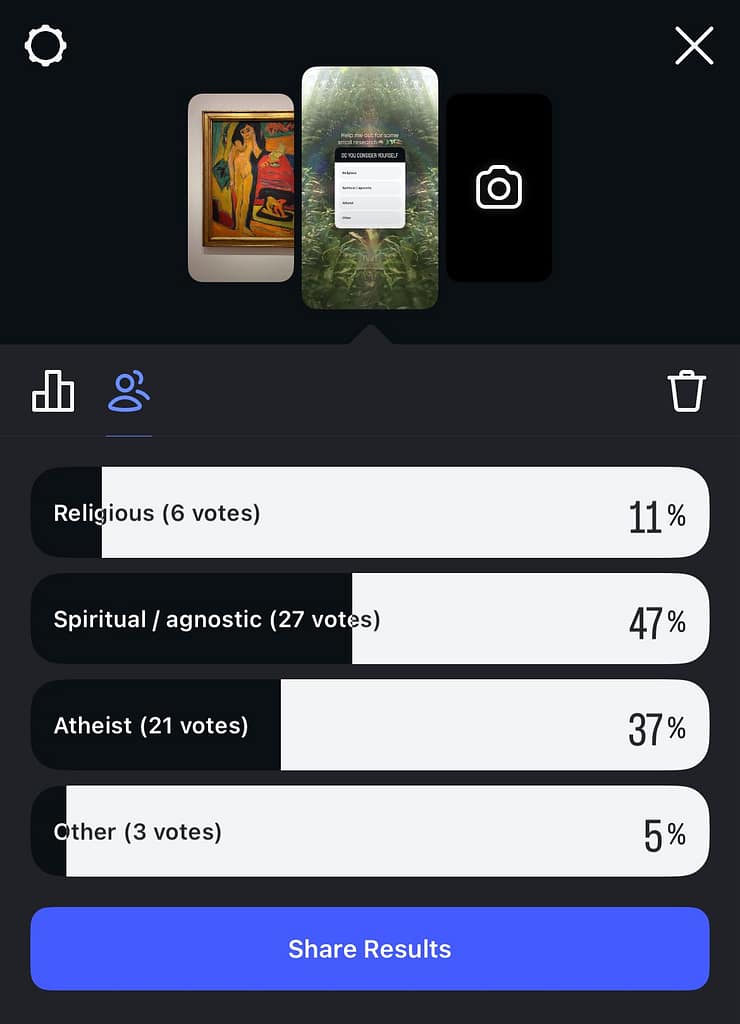
B). TARGET GROUP DATA
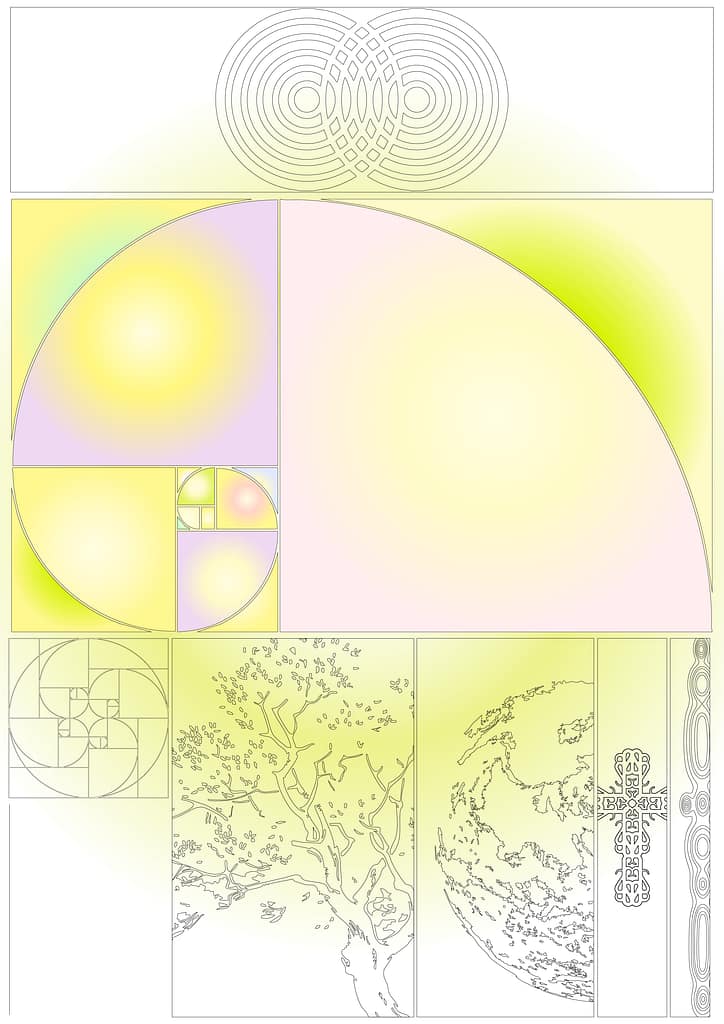
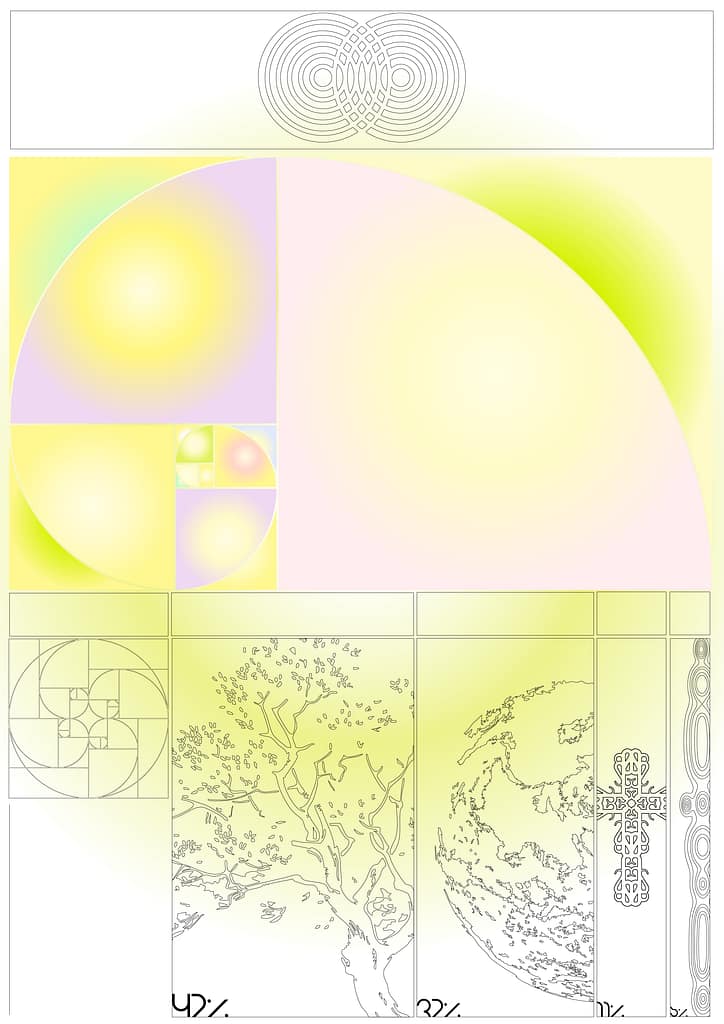
For this assignment, I wanted to visualize something that wasn’t neccessarily obvious to choose, and something that I truly find interesting and think about on a daily base. Amongst my Instagram followers, where the majority of them is around my age and a student at Minerva, I asked what level of ‘spirituality’ they identified themselves with. Everyday I start my day with thanking God for a new day. This is something small (yet big) what I always do, and it made me wonder if there are other people that might do things like this. The results of this poll I put on my Instagram story, I visualized.