5. A + B Find factual information around Minerva
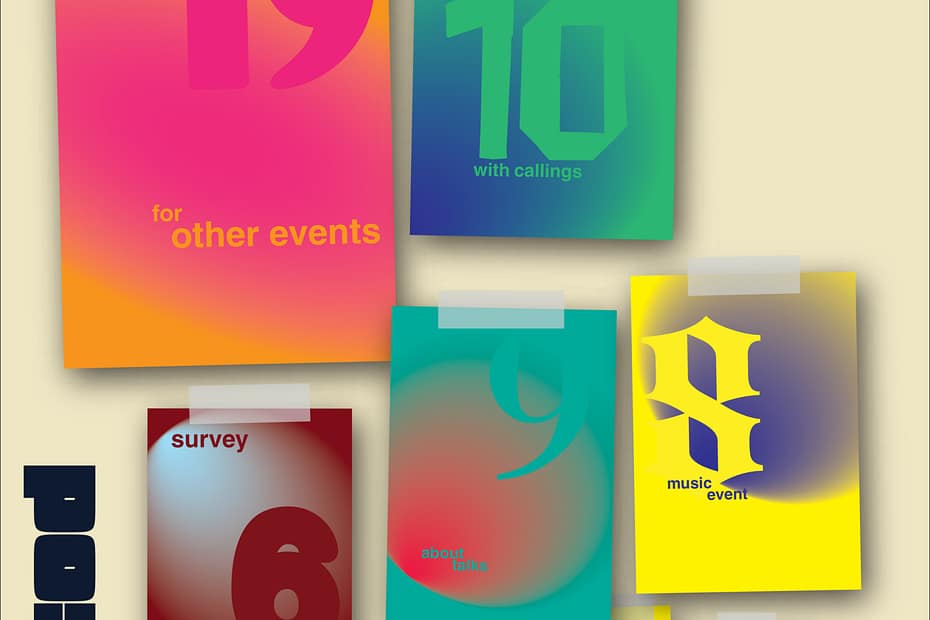
For this assignment, I was looking around Minerva for a topic that I found interesting. I thought of the colors of the canteen that could be turned into statistics or the type of clothes people are wearing, but when I entered the school, I found something else that I found interesting and wanted to use for an infographic. When entering the building, there are these two walls filled with a lot of different posters/flyers. Looking at these posters, I thought of the topics I could use, like the colors of the posters or the topics they had on them. The last one was what I chose to analyse, and I started by counting and categorizing the topics before turning them into a graphic. For the medium and the target group, I chose to focus on the students and staff of Minerva. I drew the different statistics into a few infographics and combined them into one in Illustrator.
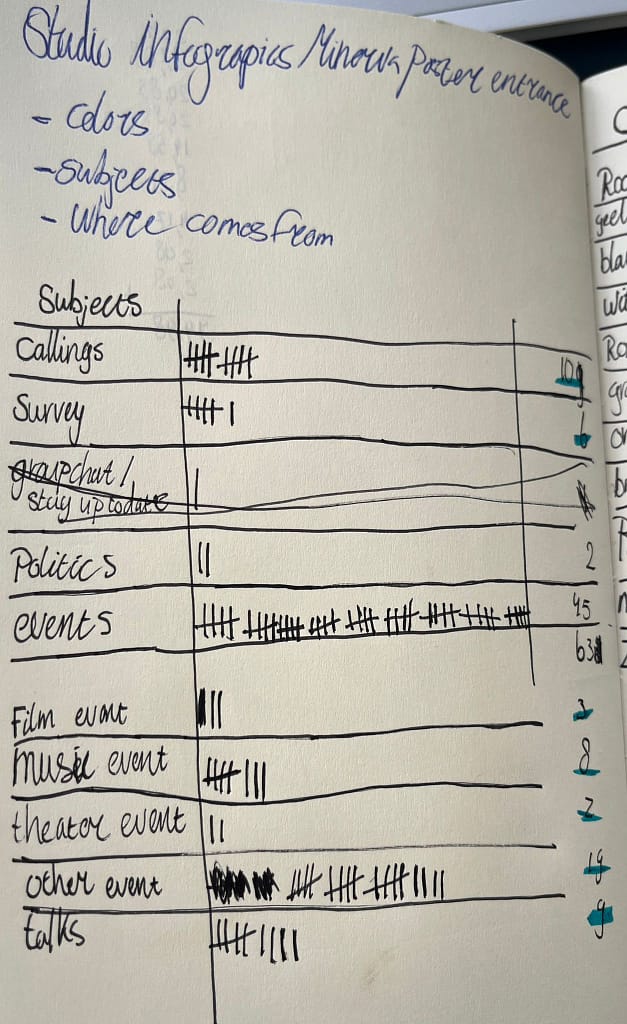
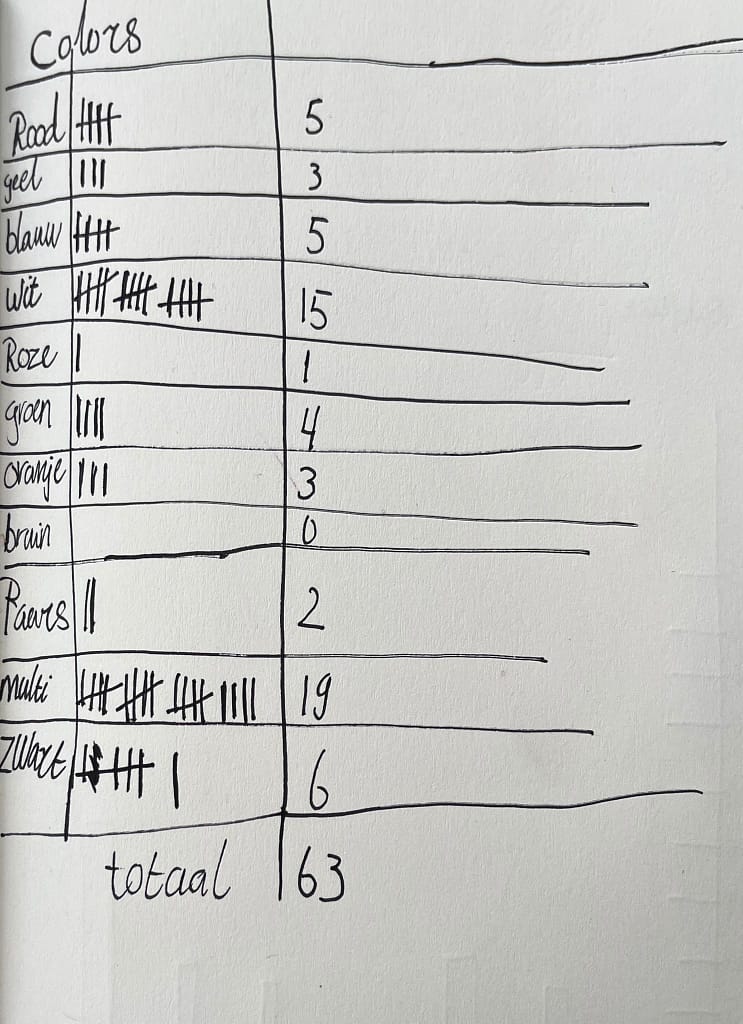
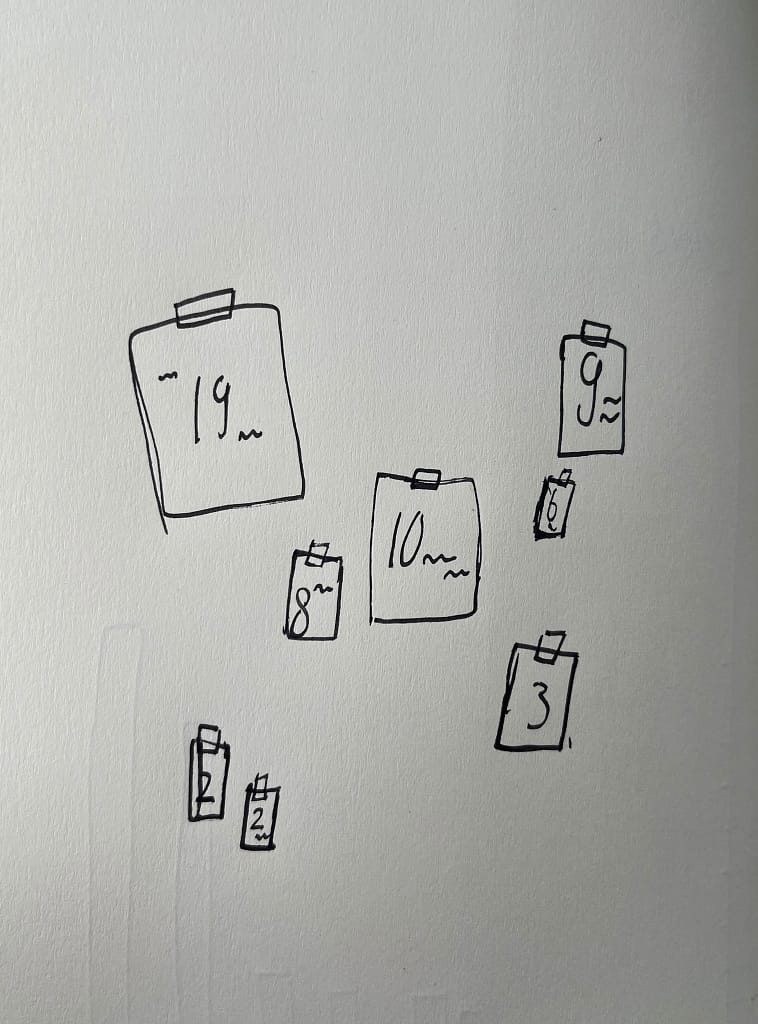
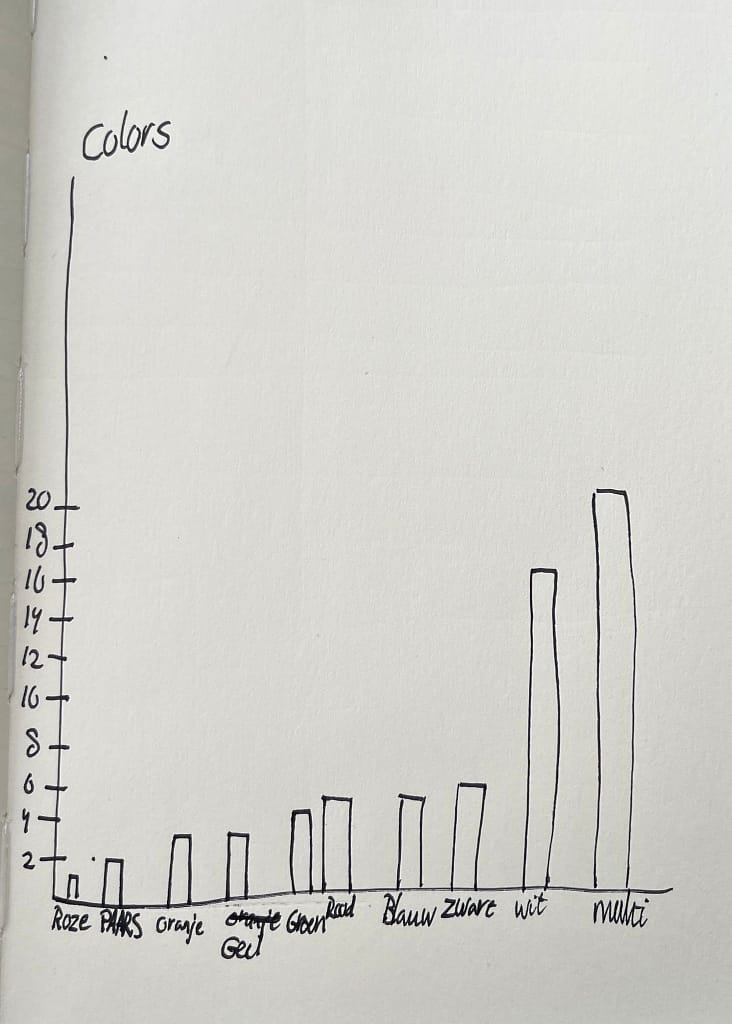
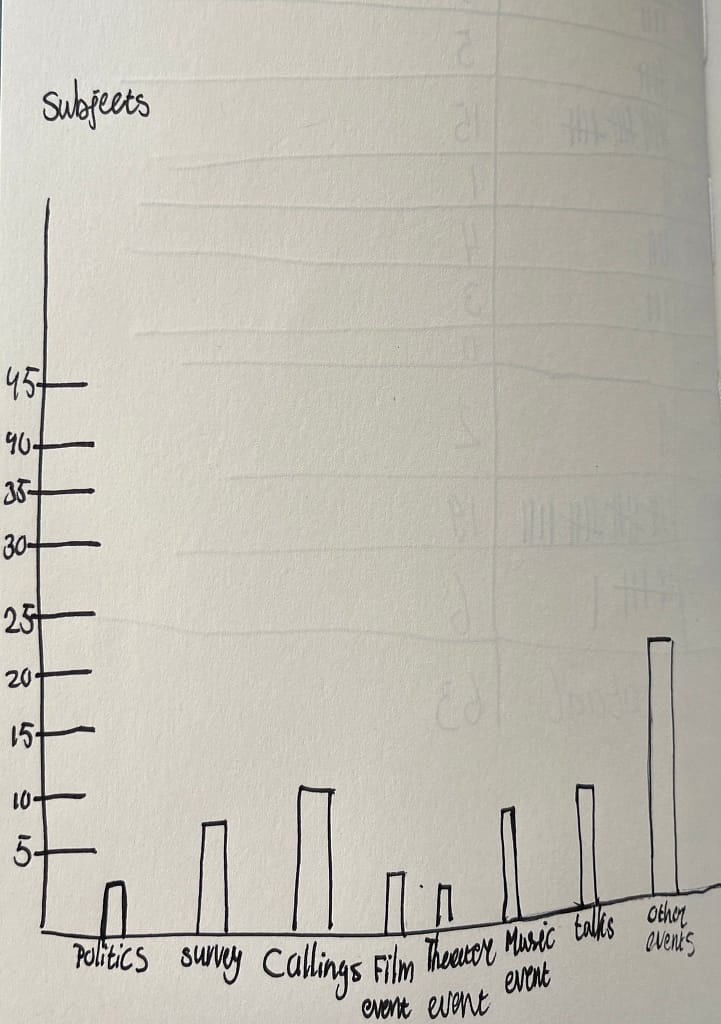
Sketches and notes for the infographic
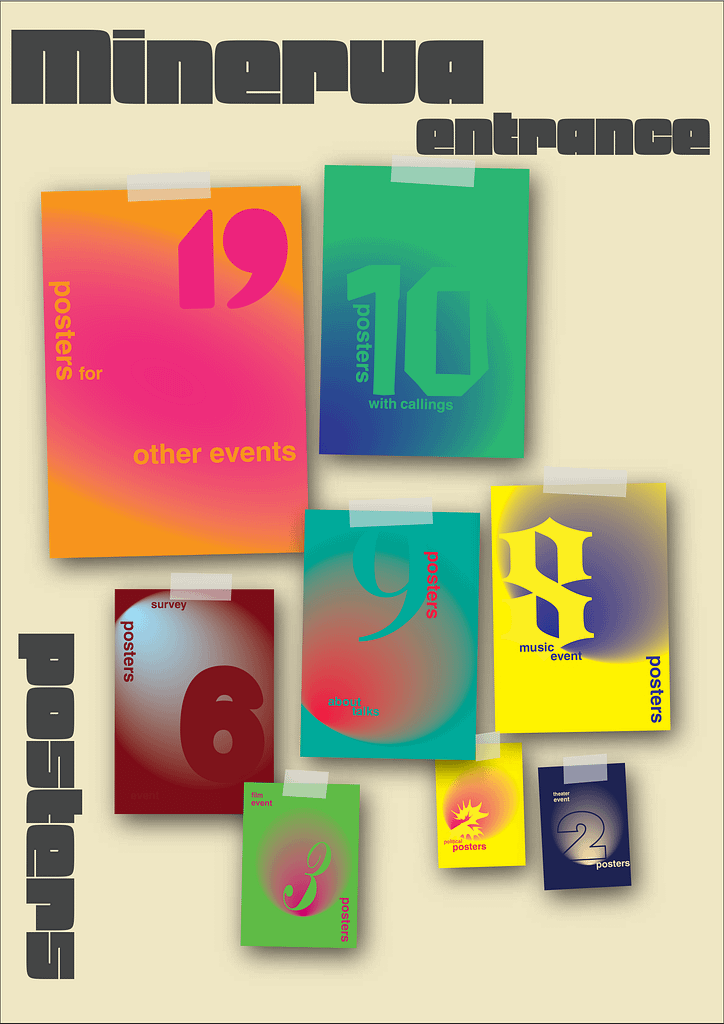
Digitalized and made different versions
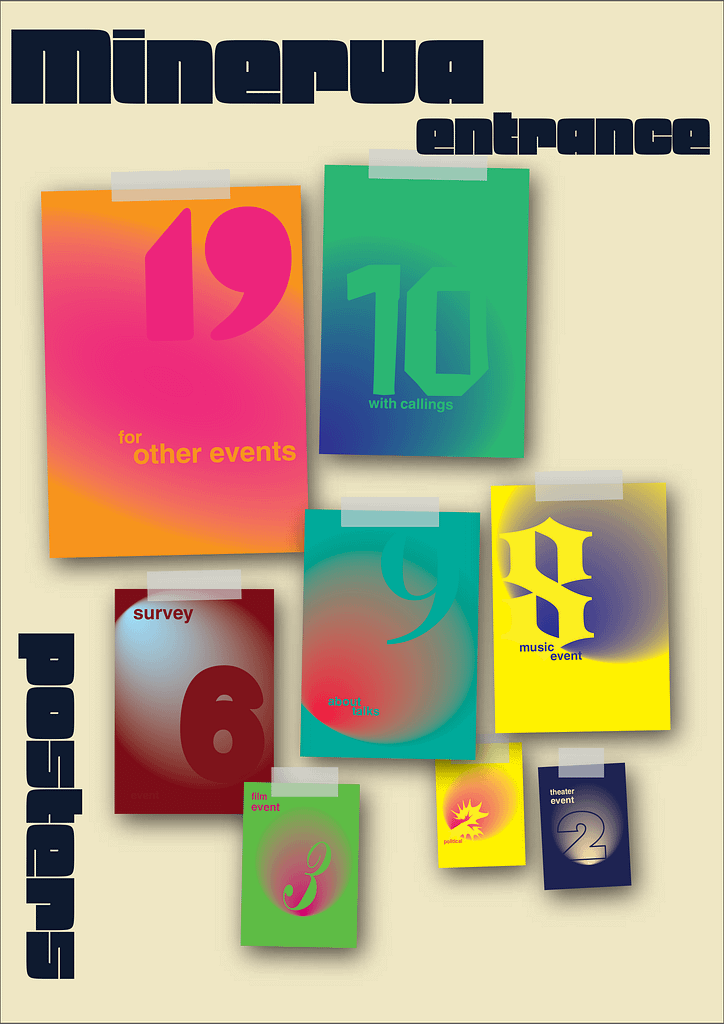
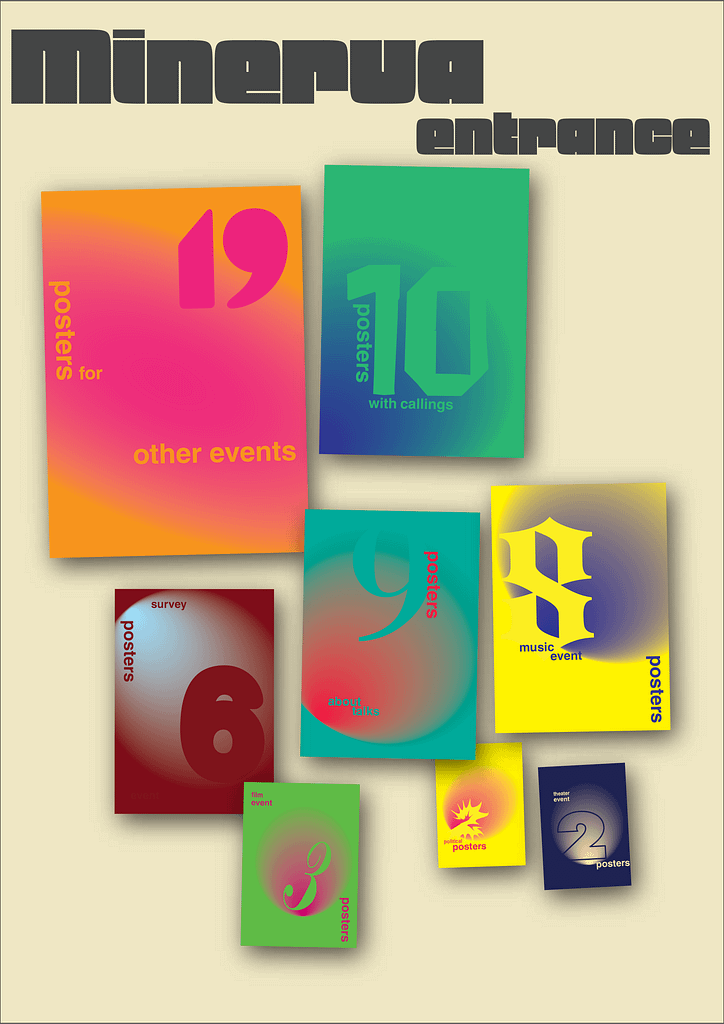
After trying different options with the text ‘poster’, I landed on this last version