VISUALIZING EVERYDAY DATA
(WITH INFOGRAPHICS)
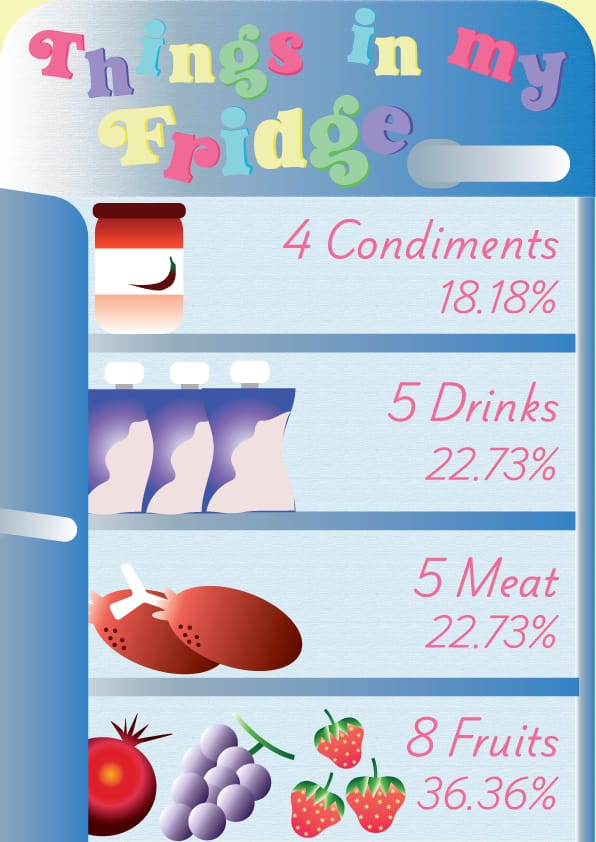
1. The Now
I choose things in my fridge to be topic and visualize it in category and calculate the amount to be percent for each one.

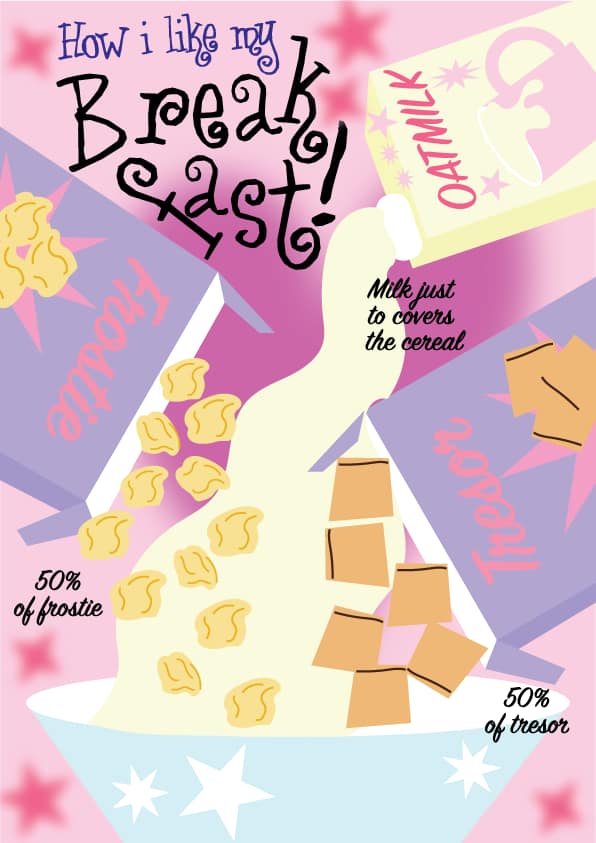
2. How did your day start
I write down everything in my notebook and visualize my breakfast

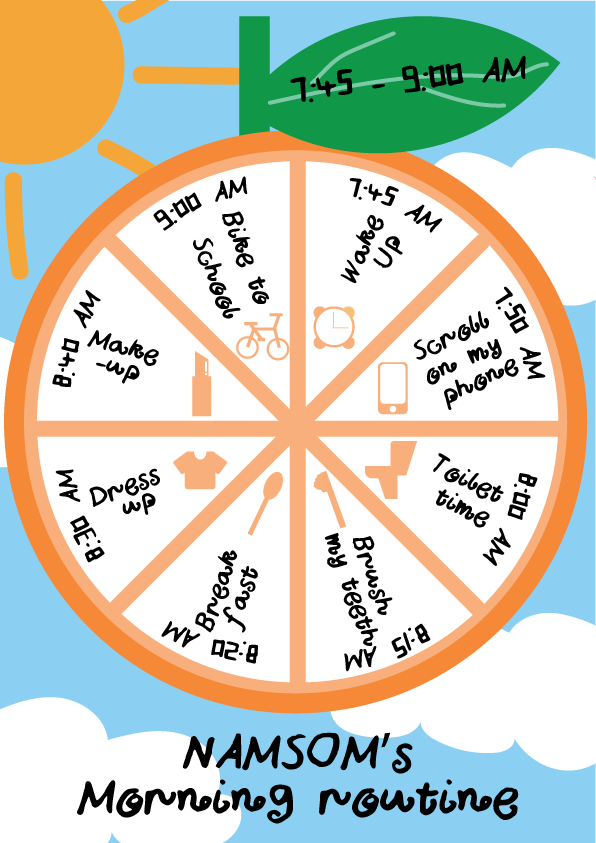
3. Timeline
A.
Make a timeline of what you did before you came to class.
Visualize the timeline

B.
Find the dates of your breakfast.

This is my process, I choose data that I want to do for each topic and sketch it out in my notebook.