Visualising everyday data
A.
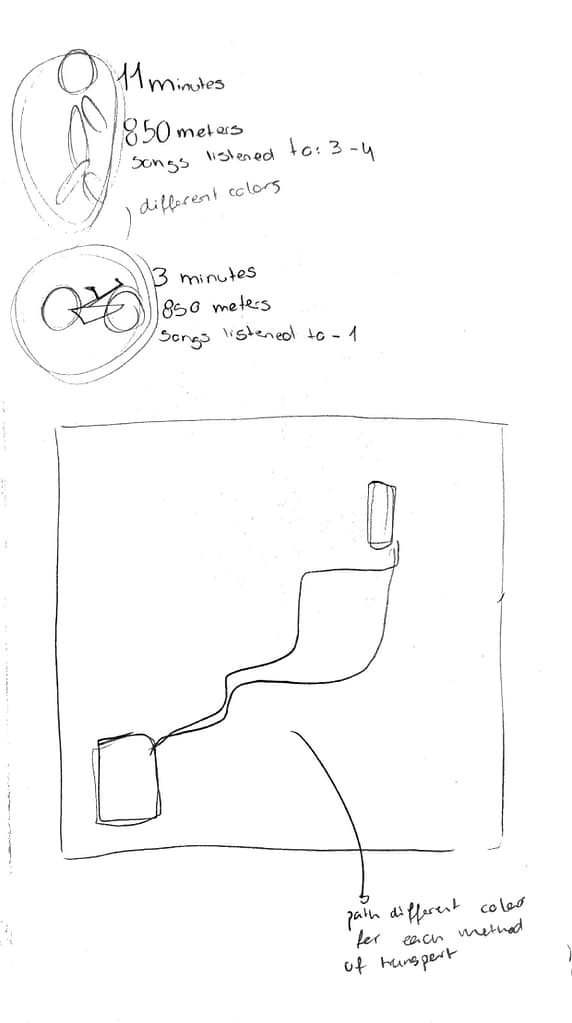
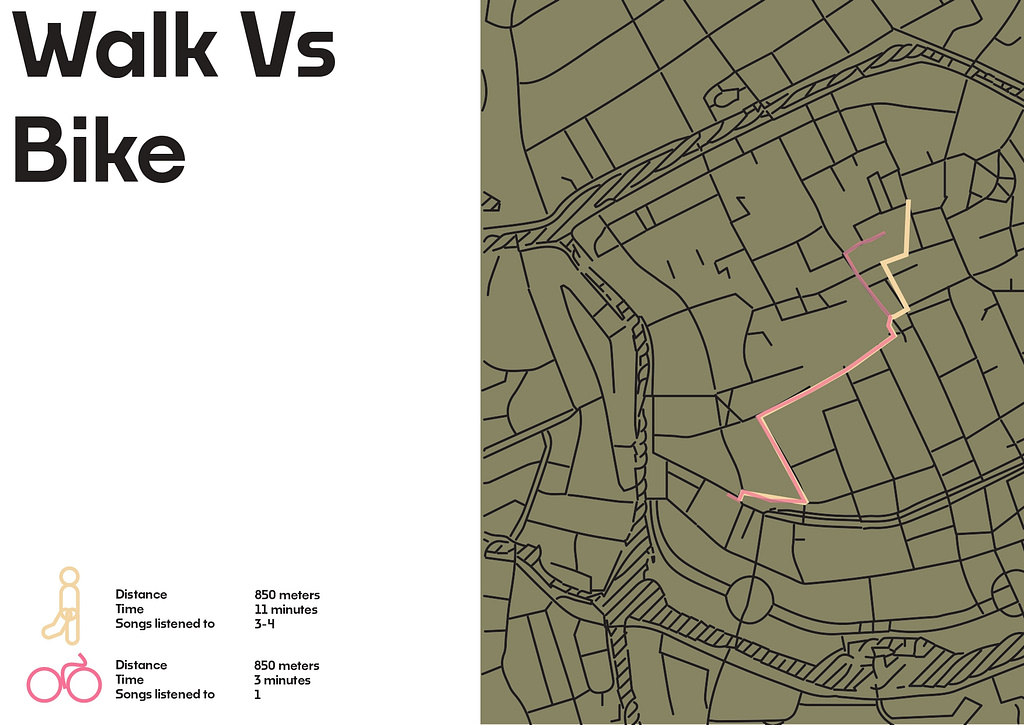
After going through my timeline I decided to go deeper into the walk from my house to Minerva. I thought it’d be interesting to see what the differences were between me walking versus me biking. I analysed the time, the distance, the path taken and how many songs I can listen to depending on the mode of transport. Following this, I visualised the data collected.
Sketches
Final
B.
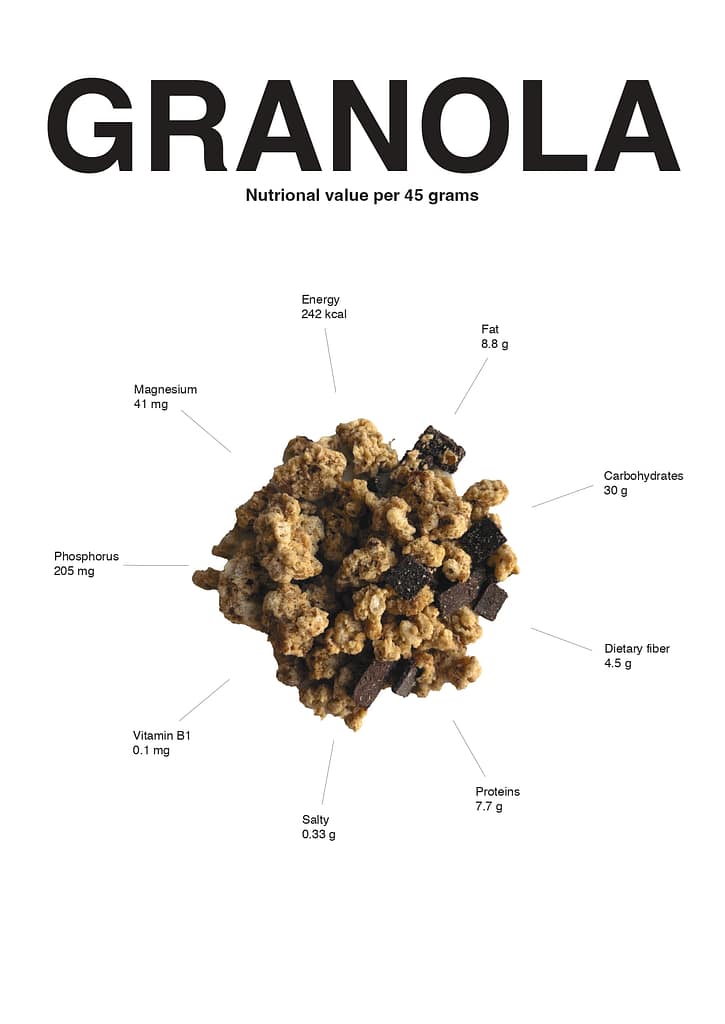
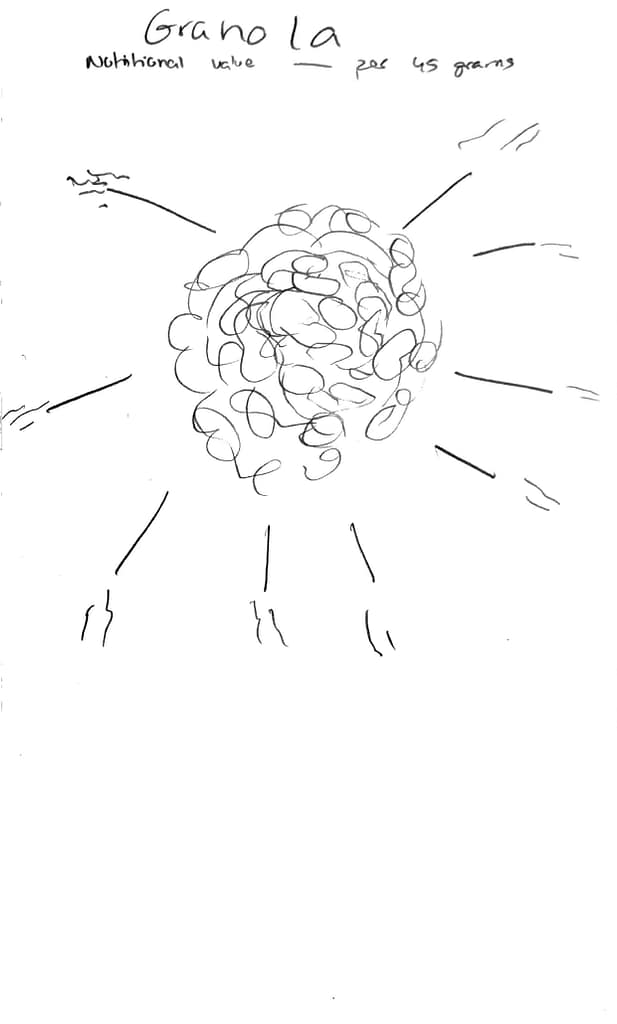
For this assignment I decided to look into the granola part of my breakfast. From the granola box I found the ingredients along with the nutritional value. From the both I decided to create an infographic based on the nutritional value, as that is what I found more interesting.
Sketches
Final