4. A Find factual personal information
The part of the morning routine that I picked for this infographic is the part where I am in the bathroom. I chose this part of my morning to zoom in on because of the many different products with different information they have that could be turned into many different statistics. For example, the color of the products or the number of the products. For this infographics I went with the last one, and chose to count the different types of products I could count, like hair or body products. I started by counting and calculating them into percentages. I then drew a couple of sketches I had for the designs. With those sketches, I went into Adobe Illustrator and combined the information I had gathered into an infographic about the number of products and their specifics that I could find in my bathroom.
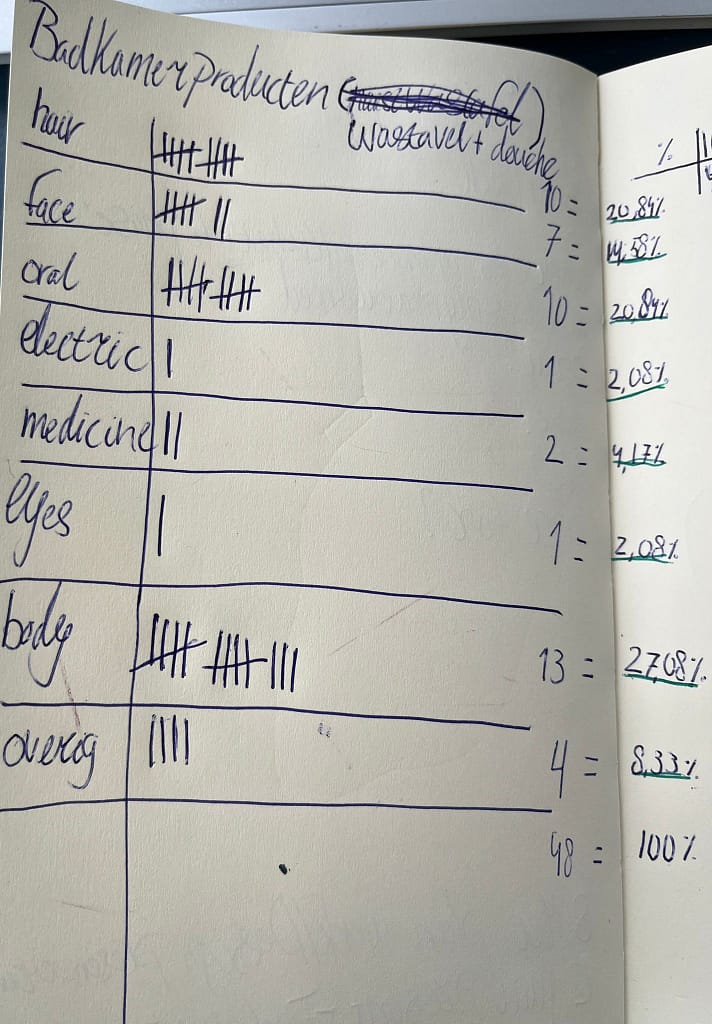
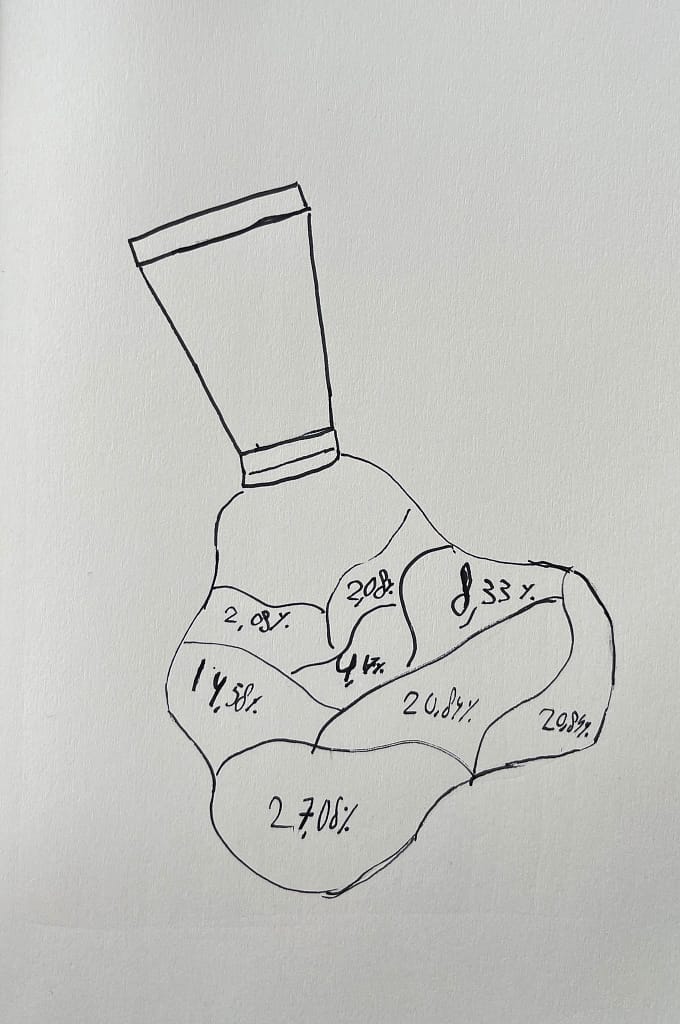
Sketches and notes for the infographic
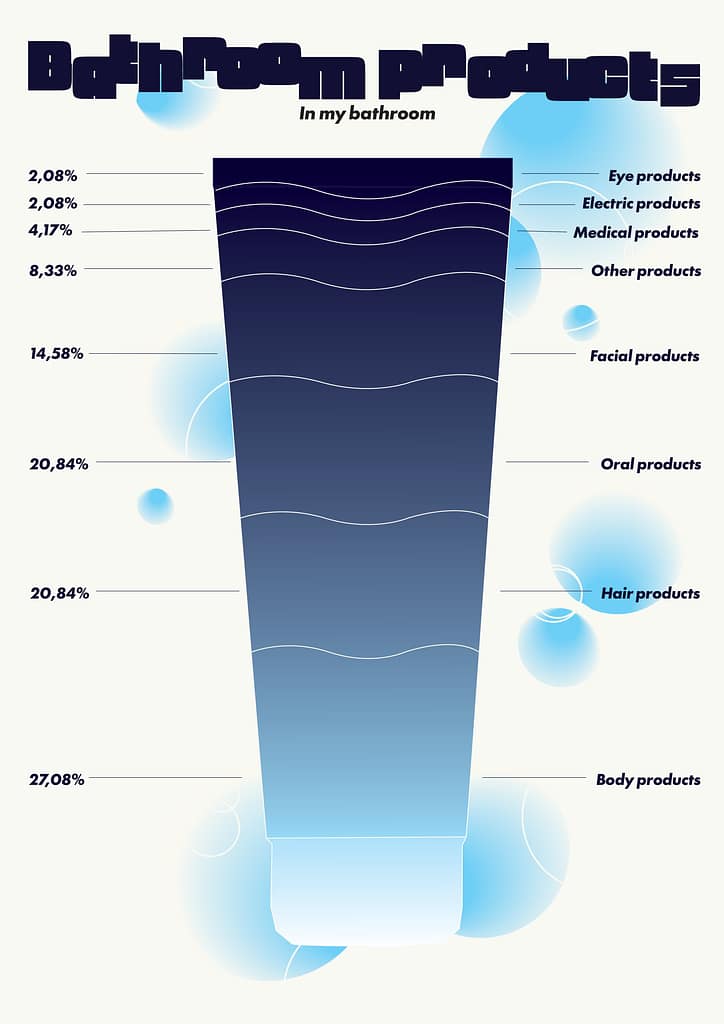
Last version
4. B Choose one part of your breakfast
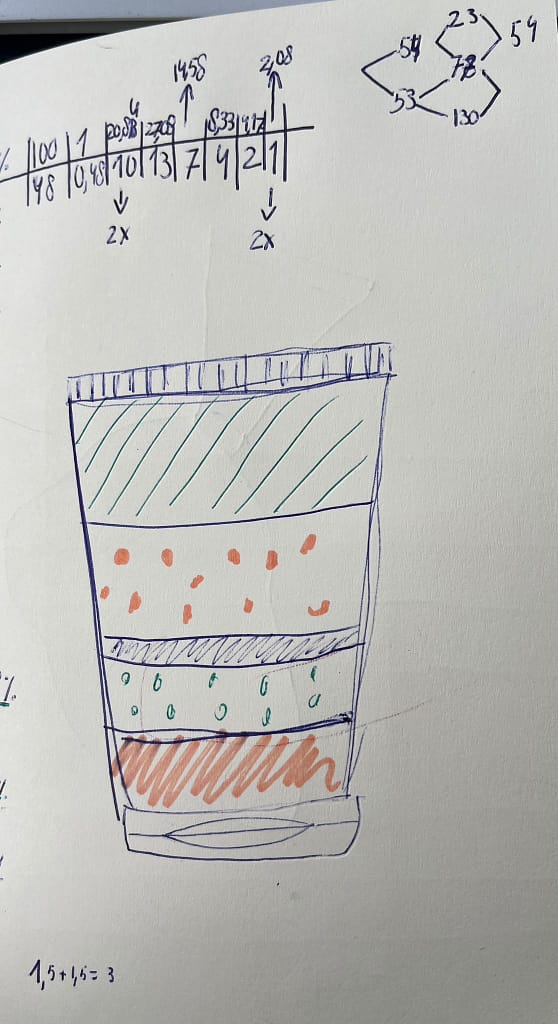
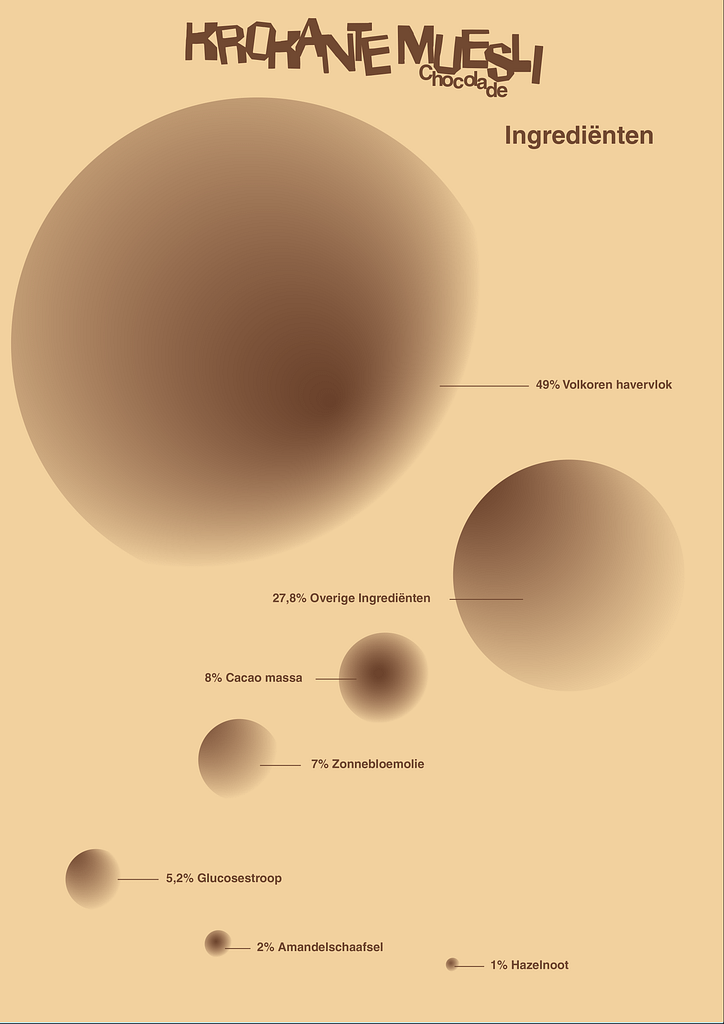
The ingredient of my breakfast that I chose was the muesli that I ate that morning. On the package, I found how it was made, and the nutritional value the muesli had. But for the infographic, I chose to use the ingredients and the amounts, with the amounts in percentages. Some of these percentages were already on the package, some weren’t. So, for these, I tried to calculate them into percentages. The ones I couldn’t find I merged into an ‘other ingredients’ group. After that, I drew a concept for the infographic and made it into a graphic in Illustrator.
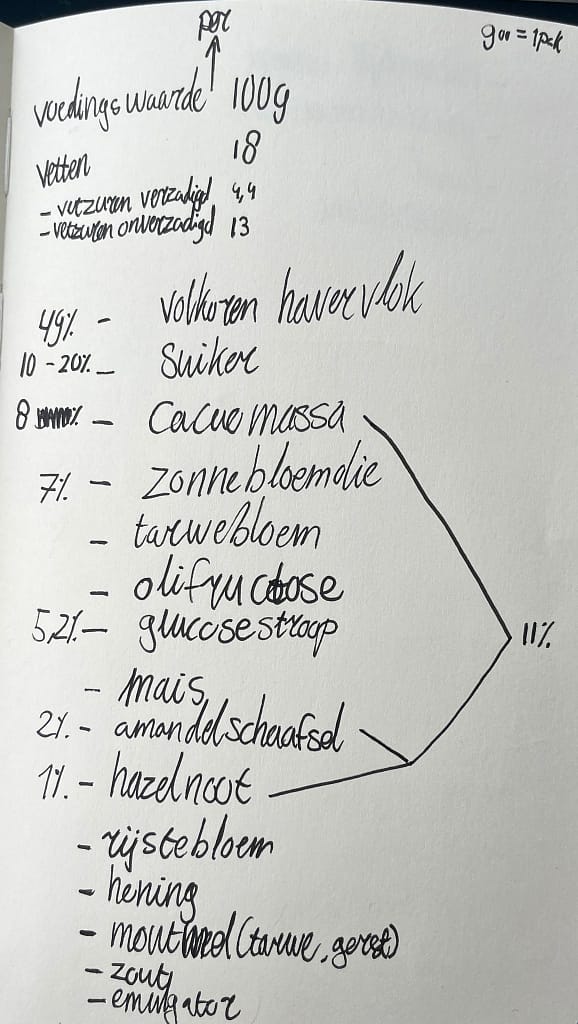
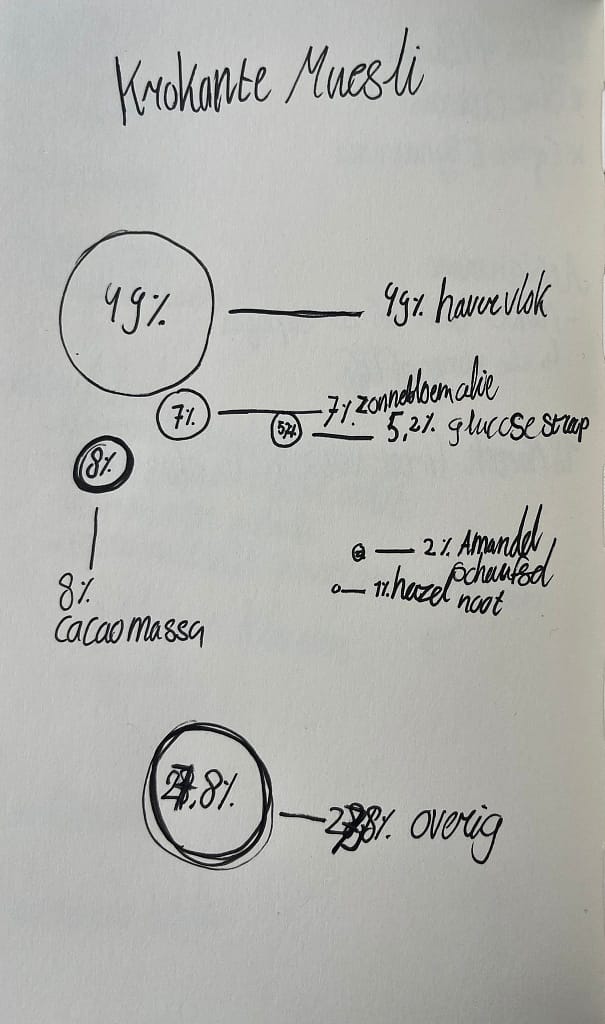
Sketches and notes for the infographic
The verst version I made I chose to use blue and yellow as they remind me of early mornings when I usually eat my breakfast. But these colors didn’t look right with the muesli topic. So then I chose brown colors that match the muesli more which I used for the last version.
Last version
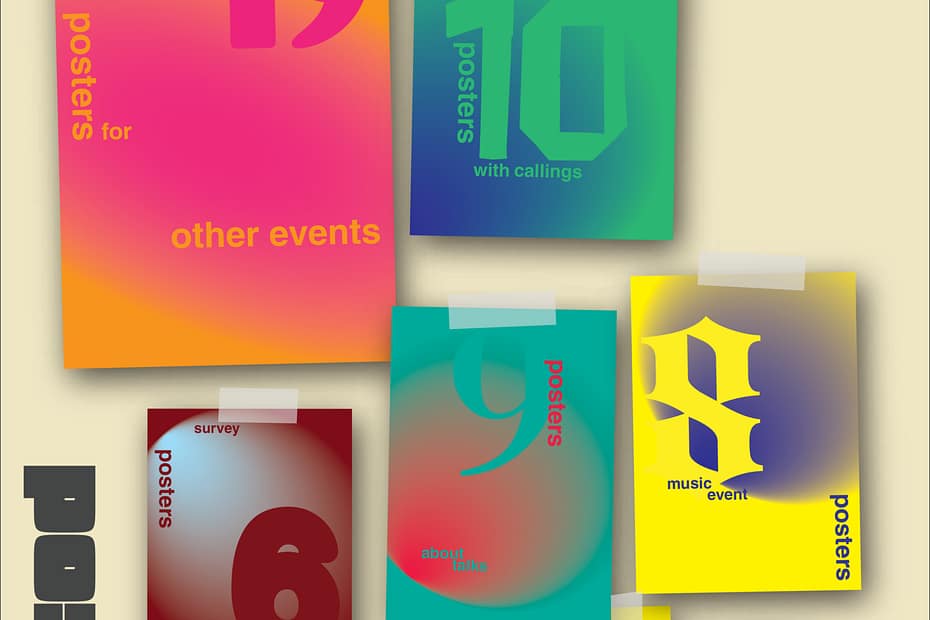
5. A/B Find factual information
For this assignment, I was looking around Minerva for a topic that I found interesting. I thought of the colors of the canteen that could be turned into statistics or the type of clothes people are wearing, but when I entered the school, I found something else that I found interesting and wanted to use for an infographic. When entering the building, there are these two walls filled with a lot of different posters/flyers. Looking at these posters, I thought of the topics I could use, like the colors of the posters or the topics they had on them. The last one was what I chose to analyse, and I started by counting and categorizing the topics before turning them into a graphic. I drew the different statistics into a few different infographics and turned these into one in Illustrator.
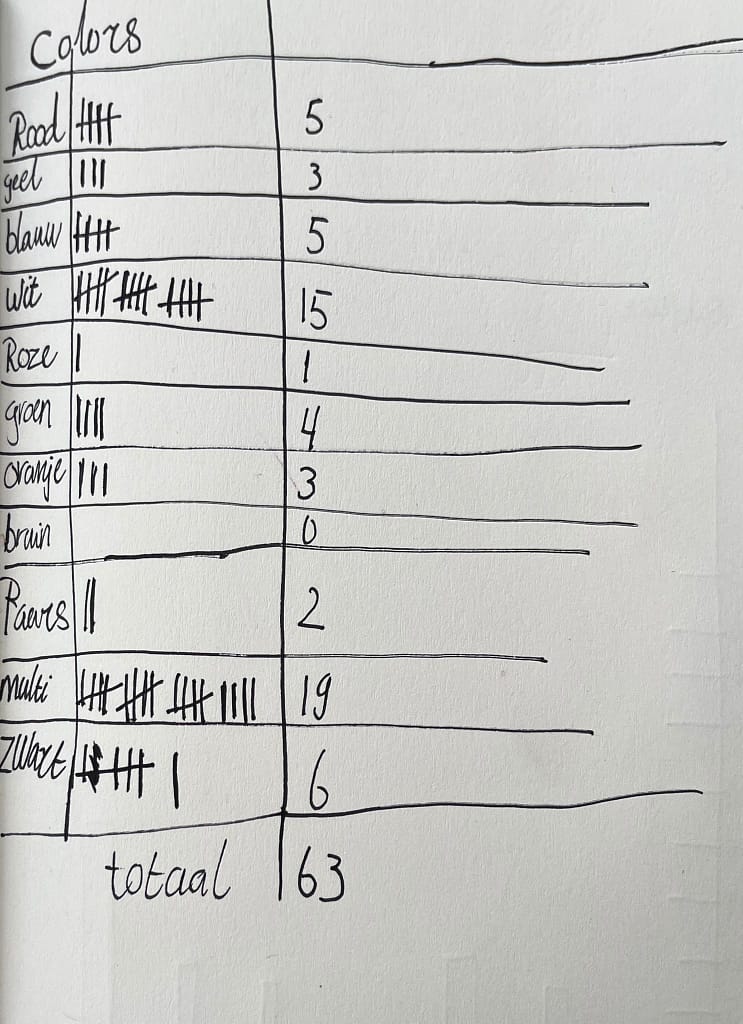
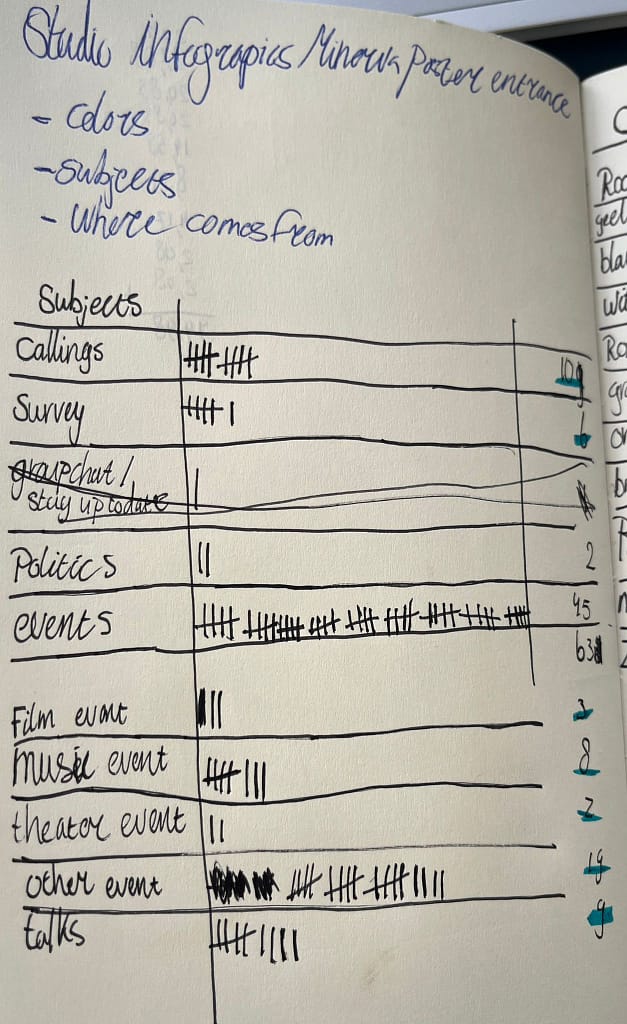
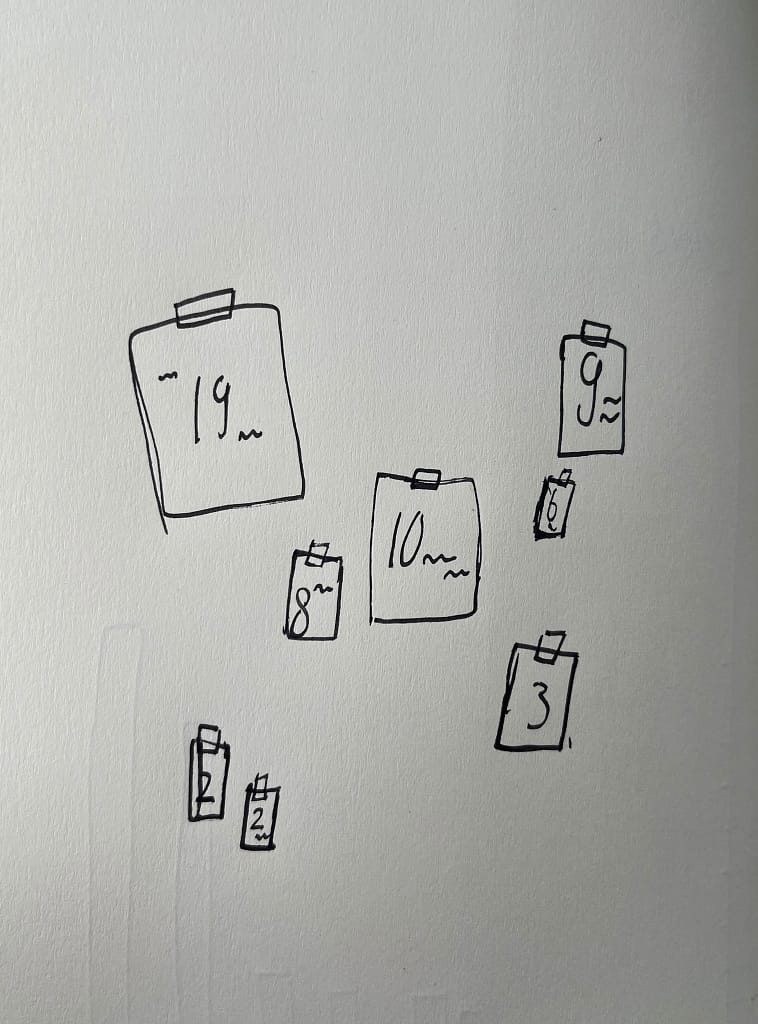
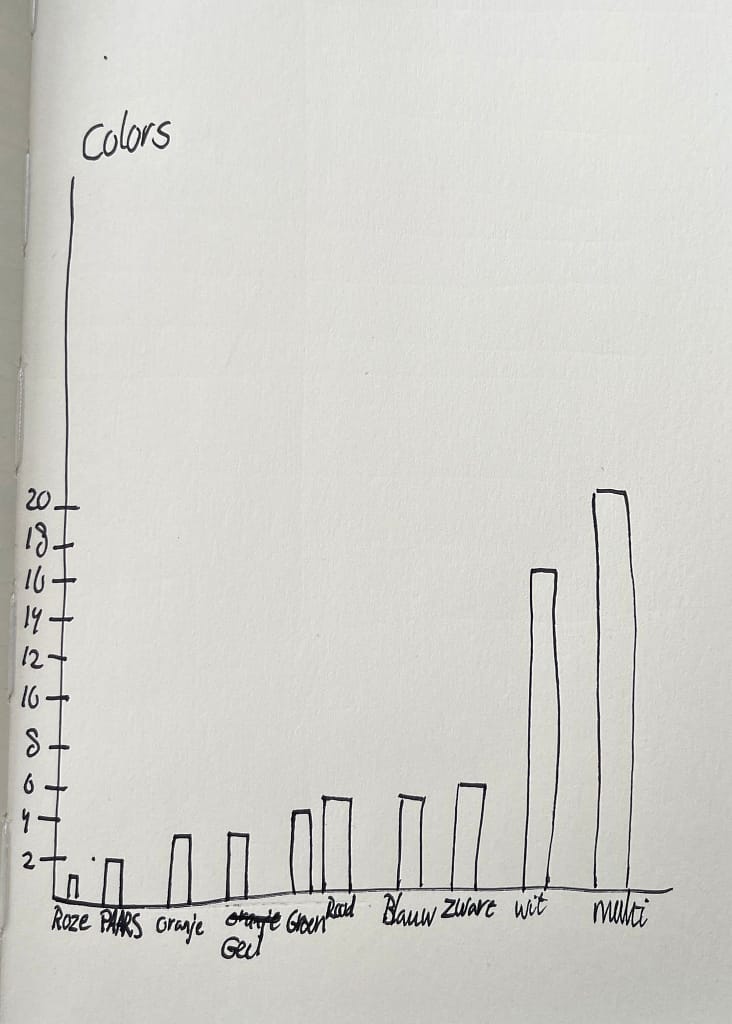
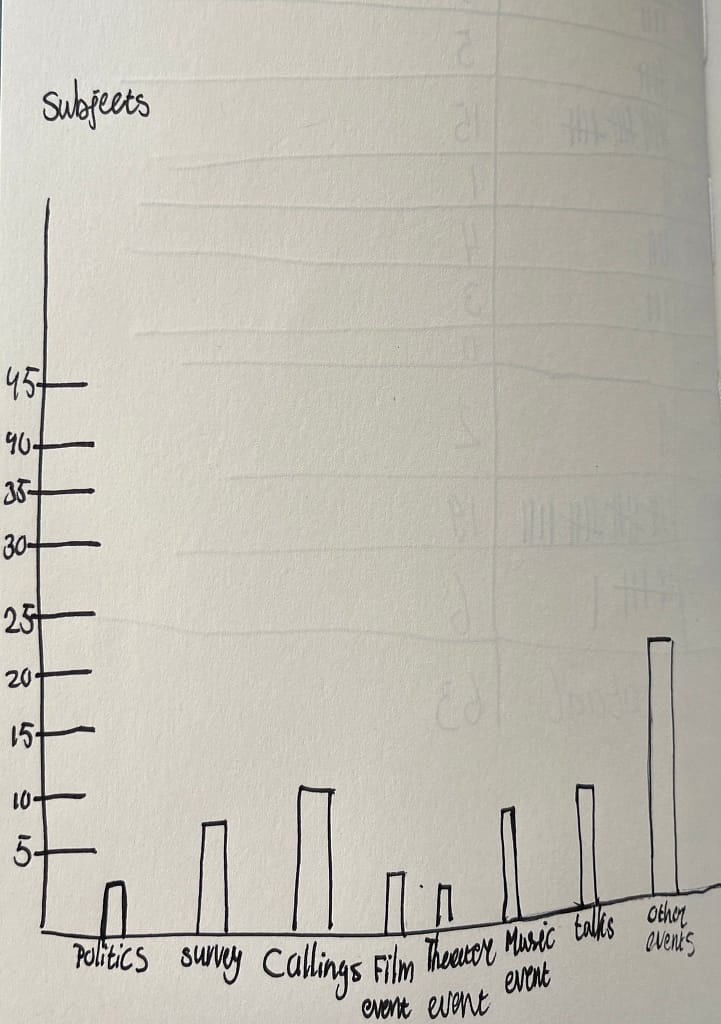
Sketches and notes for the infographic
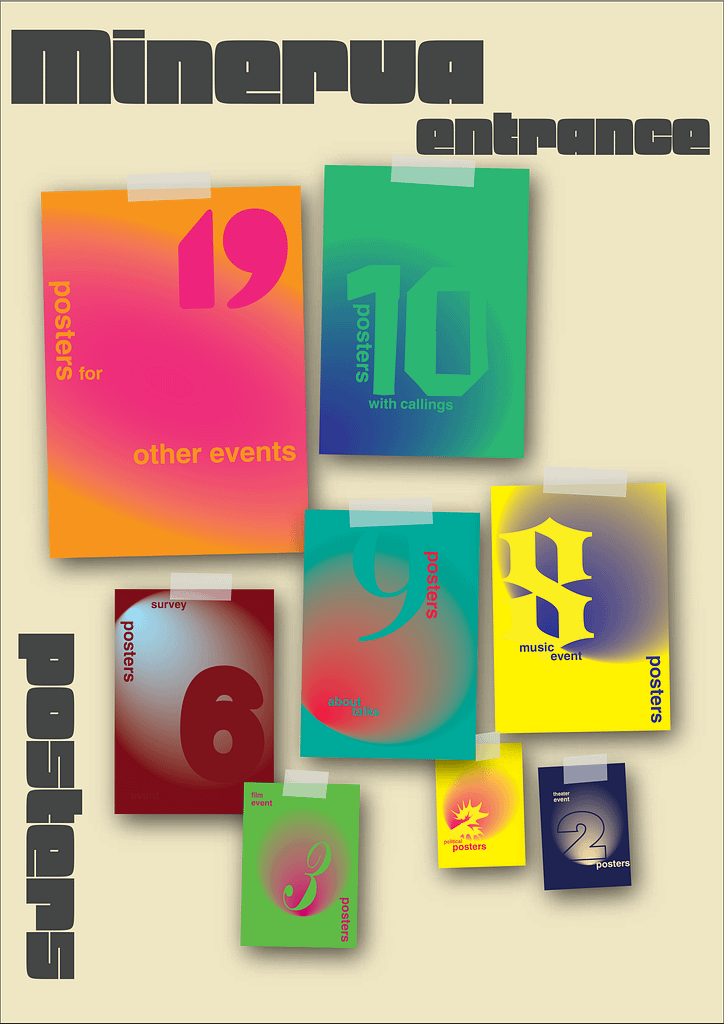
Last version