Visualising Everyday Data (with Infographics)
Inspirations
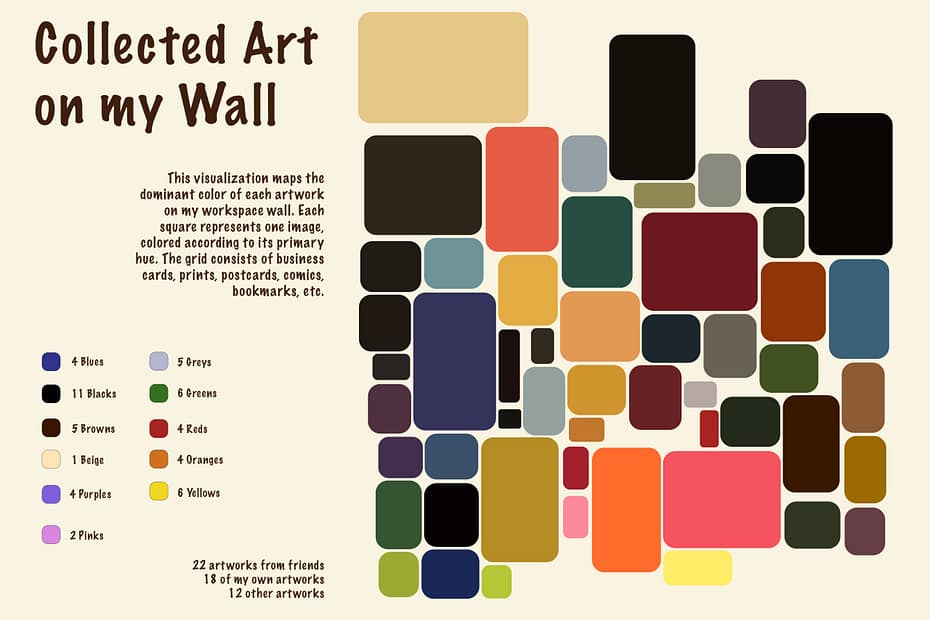
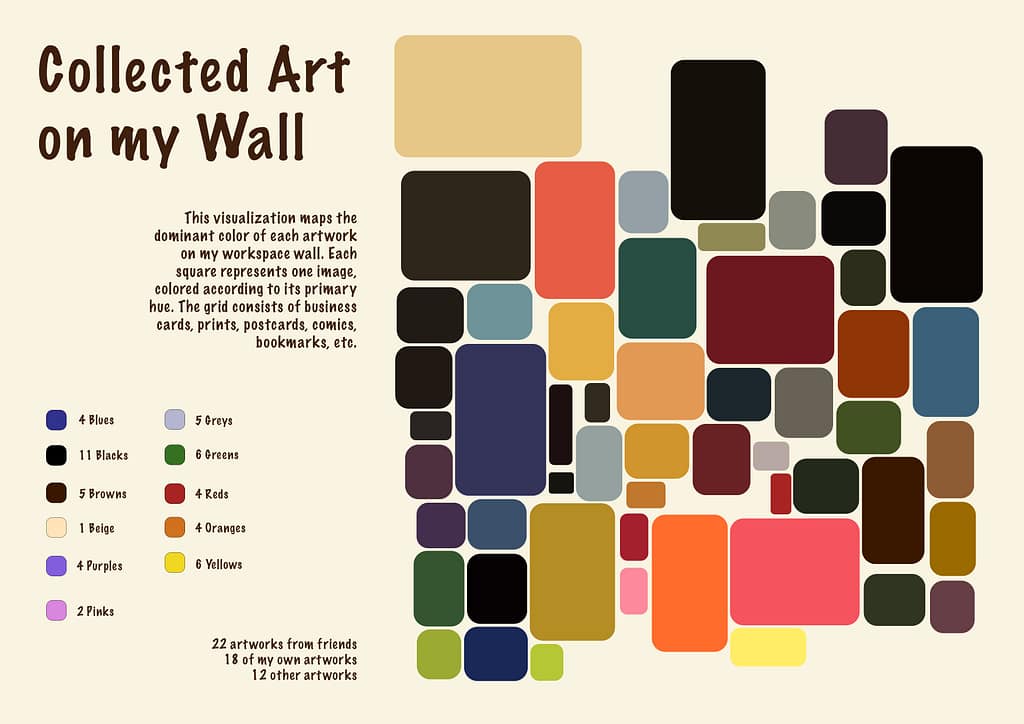
- The Now

I chose to record my room and note what I see, and then I decided to look at the art on my wall and base my infographic on the colors I see.
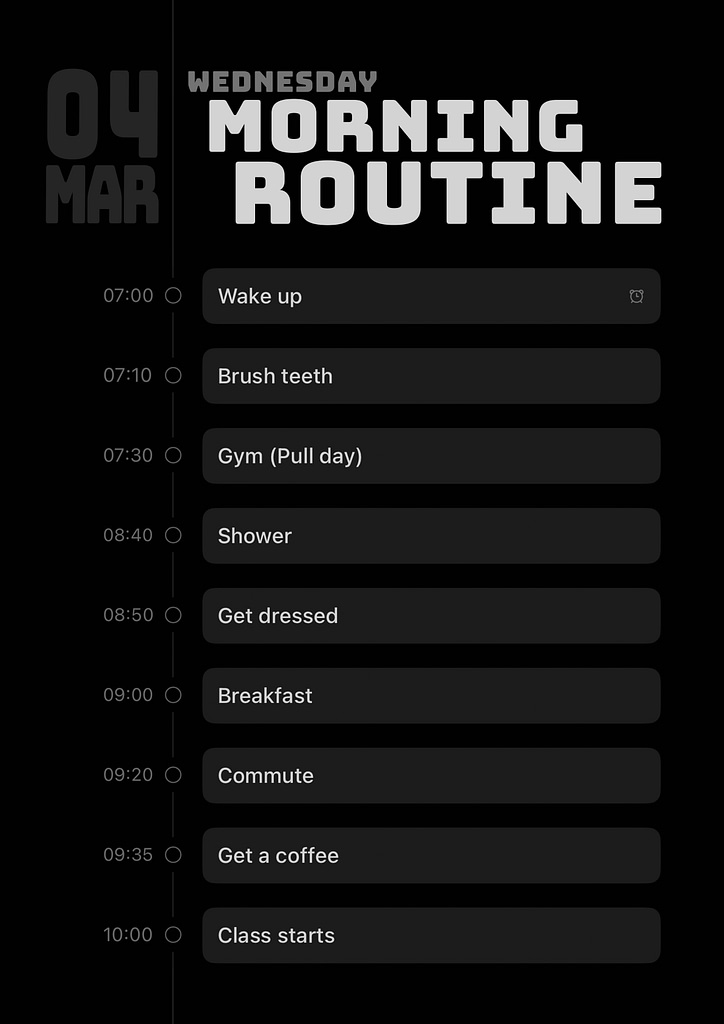
2. How did your day start
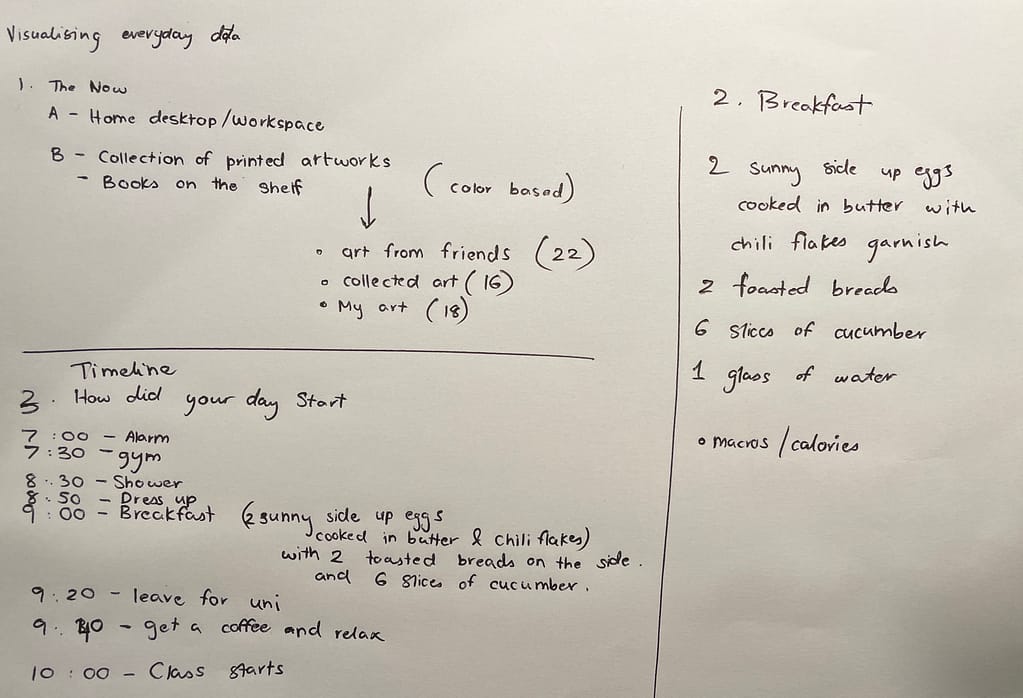
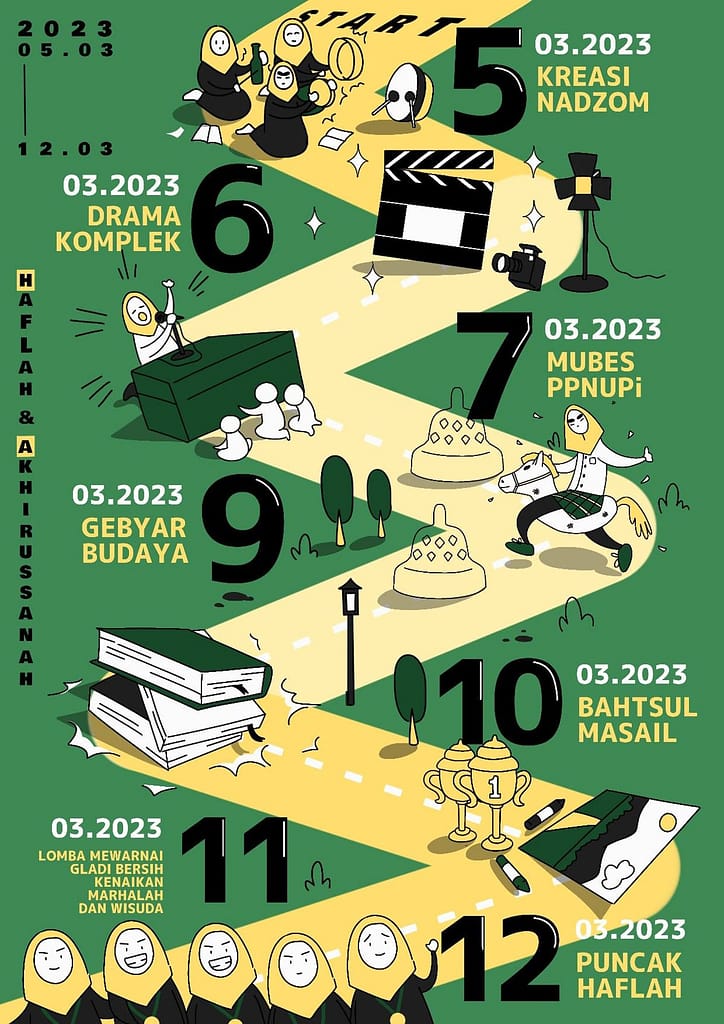
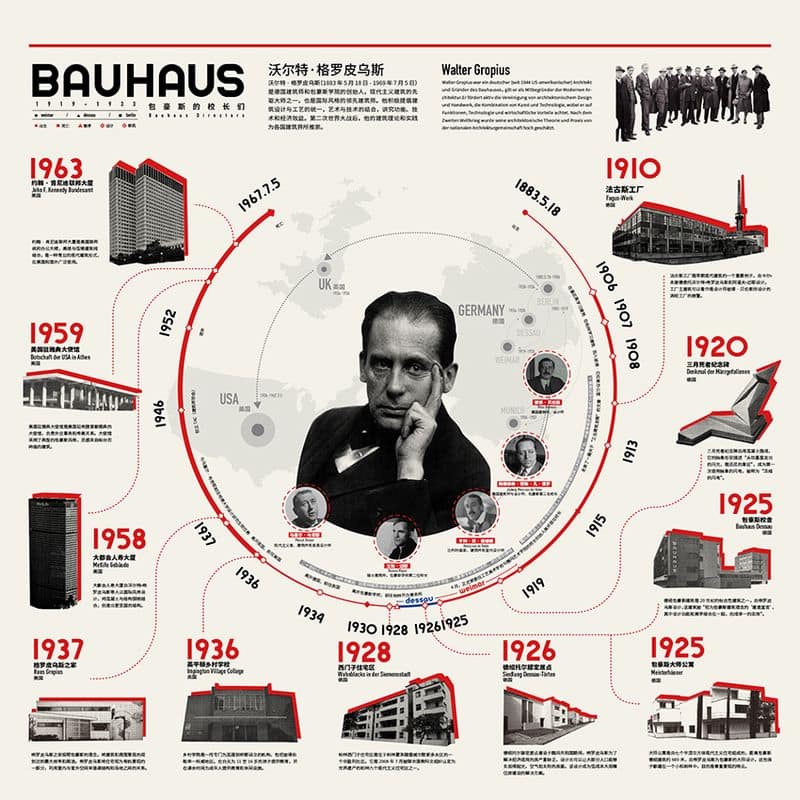
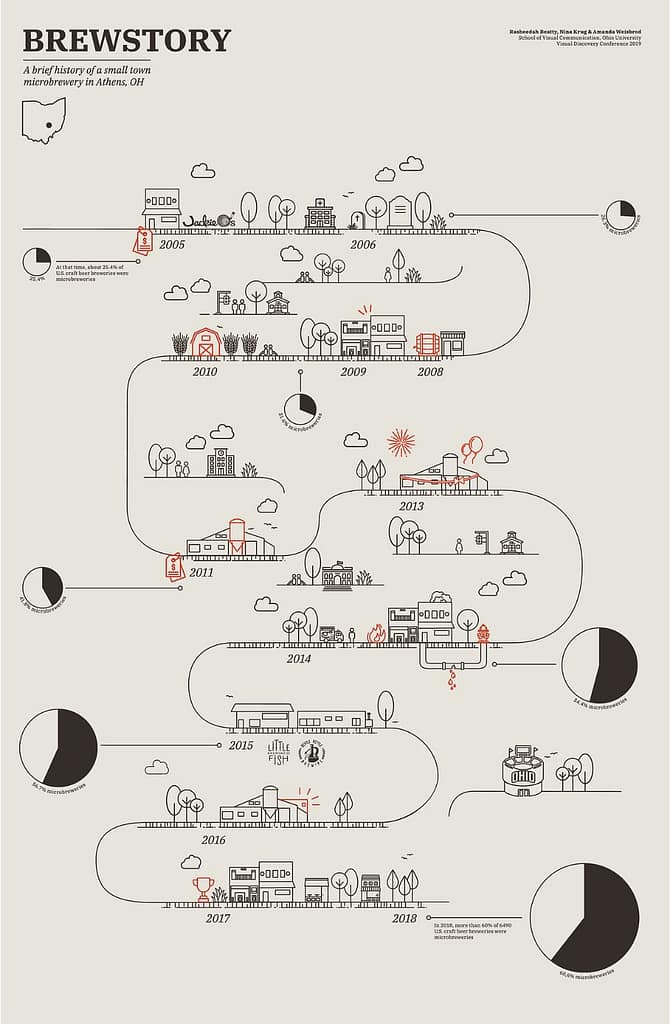
3. Timeline
A.
B.
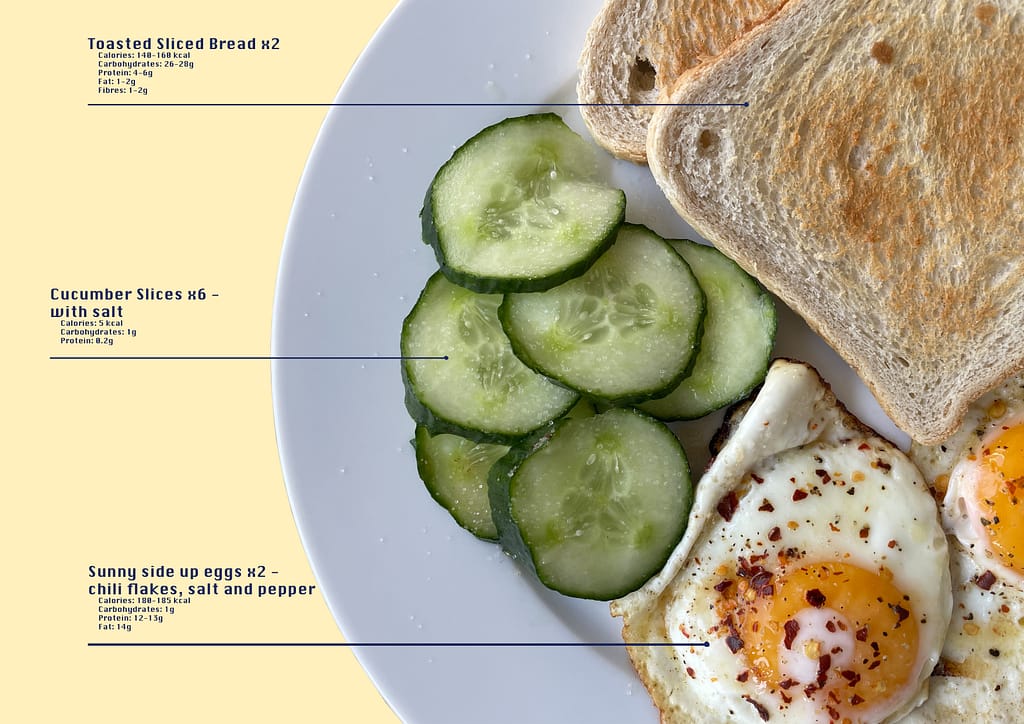
4. Find factual personal information
Part A and B)
I chose coffee, as it is part of both my breakfast and timeline. I broke it down to the ingredients that go into my coffee the way I like it, its Macros and Vitamins.

5. Data Visualisation