A. I chose my own initiative ’t freubel uur and used the data about this initiative (what/when/etc).
About ’t freubel uur
I wanted to create an obligation free creation space where students could unwind, meet new people and create for themselves. Sometimes in the heat of all the deadlines we forget why we create. Or sometimes you long for an after school activity that’s not focused on achieving goals. Or, you would like to meet new, like minded people. Whatever it is, ’t freubel uur might be the place for you.
B. The medium is analog mixed with digital, I chose to create a poster advertising this initiative. My target group is all students at minerva.
Sketches:


Illustrations/middelen first draft:


Actual first draft:


Additional notes:
For my learning goals I wanted to experiment more with type, so I decided to imitate helvetica for the title text. Also added the under-title in my own writing. I scanned in the illustrations and modified them in adobe illustrator. I wanted to create a casual-analog design whilst also training my digital skills (and keeping it readable).
(also if you want to join ‘t freubel uur feel free to do so!)
Update 08-06-25
Poster revisions after feedback last class:

Now, the infographic
A: I chose my own initiative ’t freubel uur and used the data gathered during the first session.
B: My medium is analog paper cuttings with colored pencils and fineliner. My target group is the people attending ’t freubel uur. This is a recap for them as well as insights for myself.

I couldn’t help to also do a digital version as well. I really enjoyed making my last infographic and working with the new medium of adobe illustrator.

(so much more clear)
people attending: 100% dutch, 2 people cutting, 2 people drawing, 1 person design on laptop, 5 people attending (2 men – with brows, 3 women – without brows), 75 minutes of freubel uur
Update 16/06/2025
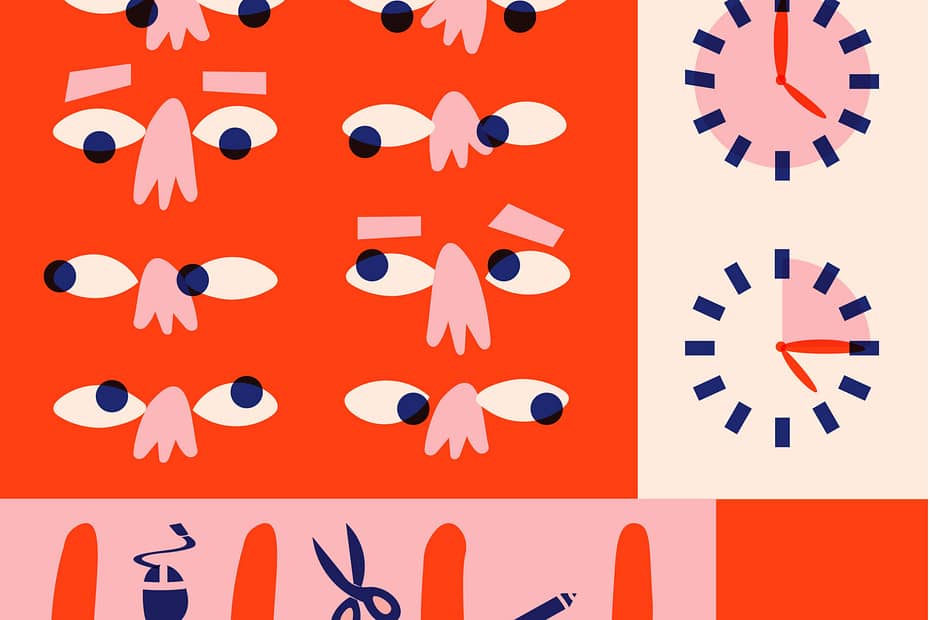
I decided to continue with the digital design for my final infographic. Training my skills in digital illustration and adding typography. I took the average of all freubel sessions for the information and portrayed it similarly like the last design. I changed the clock to be more clear, like my feedback suggested. I also added a title, making my own letters using elements from the illustrations (again, practicing my goal to get better in typography).

Average amount of people attending: 7, 6 out of 7 studying illustration, 1/7 studying graphic design, 2/7 male (with brows), 5/7 female (without brows, smaller nose), average time spent to freubel: 1 hour and 15 minutes, 3/7 working on laptop, 1/7 cutting, 1/7 folding, 2/7 drawing, 100% people attending: dutch speaking.